TL;DR
Short on time? Here's what you need to know.
Pick your category based on what matters most right now:
| Category | Top Pick | Why |
|---|---|---|
| All-in-One | Langfuse | Open source, MIT licensed, works with everything |
| Evaluation | Arize Phoenix | OpenTelemetry-native, no vendor lock-in |
| Gateway | Portkey | 250+ models, 20-40ms overhead, enterprise-ready |
| Enterprise APM | Use what you have | Datadog or New Relic if you're already paying for them |
Quick recommendations by use case:
- RAG apps: TruLens or Phoenix for retrieval quality metrics
- Agents: Langfuse or LangSmith for multi-step debugging
- Chatbots: Helicone for fast setup, Galileo for real-time guardrails
- Cost control: Helicone or Portkey as your gateway layer
- ML + LLM together: MLflow if your team already uses it for experiment tracking
Open source options: Langfuse (MIT), Phoenix, TruLens, Evidently, Helicone, Portkey, OpenLLMetry, Weave, and MLflow (Apache 2.0) all have open source versions. Opik is Apache 2.0. The rest are commercial with free tiers.
The 16 tools at a glance:
| Tool | Category | Open Source | Best For |
|---|---|---|---|
| Langfuse | All-in-One | Yes (MIT) | Most teams starting out |
| LangSmith | All-in-One | No | LangChain users |
| Braintrust | All-in-One | No | Prompt experimentation |
| Opik | All-in-One | Yes (Apache 2.0) | Comet users, low-code platforms |
| MLflow | All-in-One | Yes (Apache 2.0) | Teams that need tracing, evals, gateway, and agent serving in one platform |
| Confident AI | Evaluation | No | Evaluation-first observability |
| Arize Phoenix | Evaluation | Yes | OpenTelemetry integration |
| TruLens | Evaluation | Yes | RAG quality metrics |
| Galileo AI | Evaluation | No | Real-time guardrails |
| Evidently AI | Evaluation | Yes | ML + LLM unified monitoring |
| Helicone | Gateway | Yes | Fastest setup, caching |
| Portkey | Gateway | Yes | Multi-provider routing |
| OpenLLMetry | Gateway | Yes | Existing APM integration |
| Datadog | Enterprise | No | Datadog customers |
| New Relic | Enterprise | No | New Relic customers |
| W&B Weave | Enterprise | Yes | MLOps experiment tracking |
Shipping an LLM app without observability is like debugging with print statements in production.
You'll waste hours on issues you can't reproduce and burn money on inefficient prompts. LLM observability tools solve this by giving you visibility into what's actually happening.
LLMs are black boxes. Traditional logging captures requests and responses, but misses what matters: prompt variations, retrieval quality, and where things went wrong. What works in development often breaks in production.
Observability tools give you visibility into the full pipeline. You can trace requests end-to-end, track costs, measure output quality, and catch problems before users report them.
This guide covers 16 tools across four categories: all-in-one platforms, evaluation-focused tools, gateway proxies, and enterprise APM extensions.
What is LLM observability?
LLM observability is the practice of instrumenting your AI applications to understand their behavior in production. It covers the full pipeline from data ingestion (using tools like Firecrawl for web data) through inference to output, letting you debug issues, optimize costs, and maintain quality at scale.
The term often gets confused with related concepts, so here's how they differ:
Monitoring tracks real-time metrics like latency, token usage, costs, and error rates. This is your system health dashboard: alerts when things break, trends to track performance over time.
Evaluation measures quality through accuracy testing, hallucination detection, and relevance scoring. It acts as your quality gate before deployment and your regression detector after.
Observability provides complete request tracing that shows you why something failed. When monitoring flags an issue, observability helps you debug it by reconstructing the full chain of events, from input through reasoning to output.
Most tools blend these capabilities rather than focusing on just one. The categories in this guide reflect that reality, helping you choose based on which capability matters most for your current needs.
What makes a great LLM observability tool?
For this article, we evaluated tools based on production readiness, active development, clear documentation, and reasonable pricing (or an open source option). Research projects and abandoned repos didn't make the cut.
In 2026, the bar has shifted. Catching errors and counting tokens is table stakes. The harder problem is knowing when an output is technically valid but wrong for your domain: a hallucinated policy, a tone drift, a retrieval miss wrapped in a confident answer. The tools that matter close the gap between observing what happened and evaluating whether it was any good.
The tools in this guide offer different combinations of these core capabilities:
- Tracing depth: Step-level visibility into agent workflows, tool calls, retrieved documents, and intermediate reasoning, not just the final input and output
- Evaluation depth: Research-backed metrics for faithfulness, relevance, hallucination, and safety built in, versus tools that require you to write your own scorers
- Quality-aware alerting: Alerts that fire on quality regressions (faithfulness drops, safety failures, prompt-level drift), not just on latency spikes or 500 errors
- Cross-functional access: PMs, QA, and domain experts can review traces, annotate outputs, and run evaluations without an engineer in the loop
- Production-to-development loop: Production traces flow back into evaluation datasets, so test coverage grows alongside real usage
- Cost tracking: Token usage and API spend aggregation to catch runaway costs before they hurt
- Integration and self-hosting: Native support for your stack (LangChain, LlamaIndex, vanilla API calls, OpenTelemetry) plus the option to run on your own infrastructure if data residency matters
No single tool excels at all seven. The categories below group tools by their primary strength, helping you match the tool to your most pressing need.
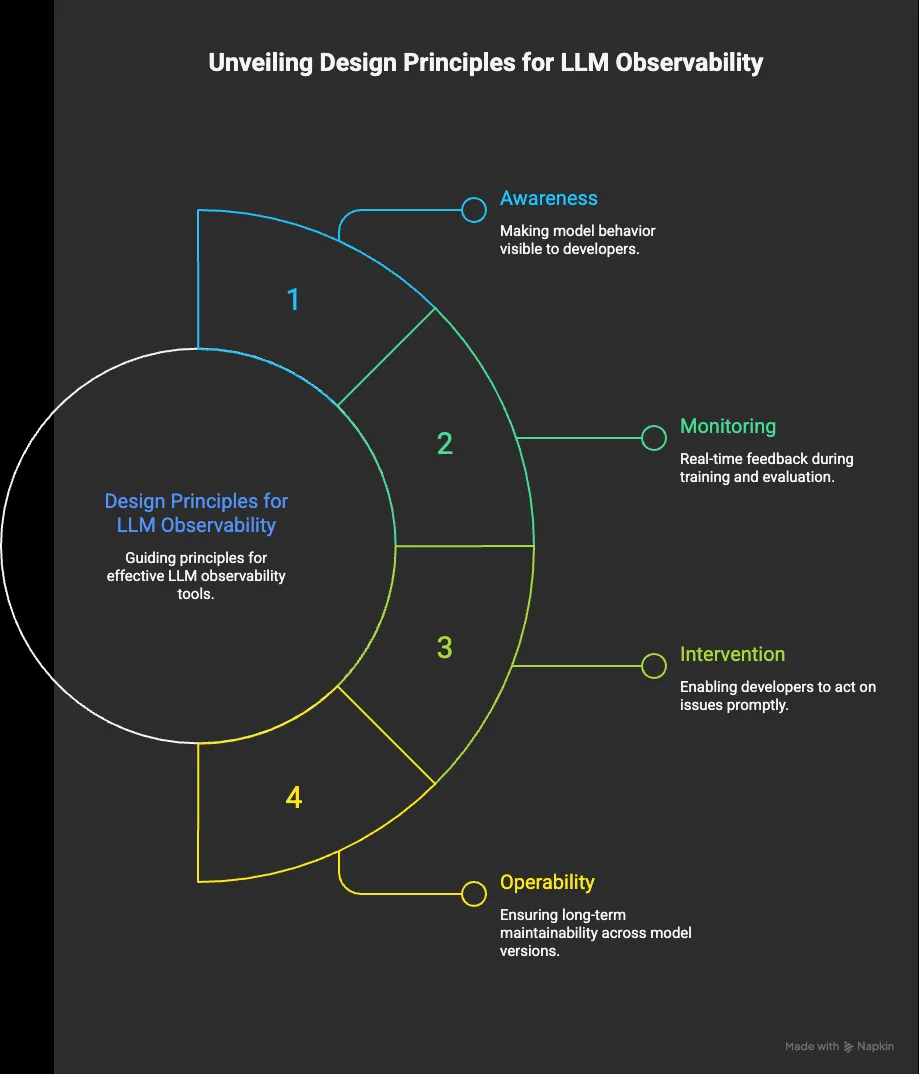
A CHI 2025 (Conference on Human Factors in Computing Systems) study with 30 developers identified four core design principles every good LLM observability tool should address:
- Awareness — makes model behavior visible so developers understand what's happening inside the system
- Monitoring — provides real-time feedback during training and evaluation to catch issues early
- Intervention — enables developers to act on problems as they surface, not after the fact
- Operability — supports long-term maintainability as models and requirements evolve
The study also surfaced a useful tension: tools optimized for fast intervention tend to reduce developers' mental model clarity, while awareness-first designs deepen understanding but can slow response time. It's worth keeping in mind when deciding which tool fits your workflow.
All-in-one platforms
Best for: Most teams starting out
These platforms combine tracing, evaluation, and prompt management in a single package. If you're not sure where to start, pick one from this category.
Langfuse
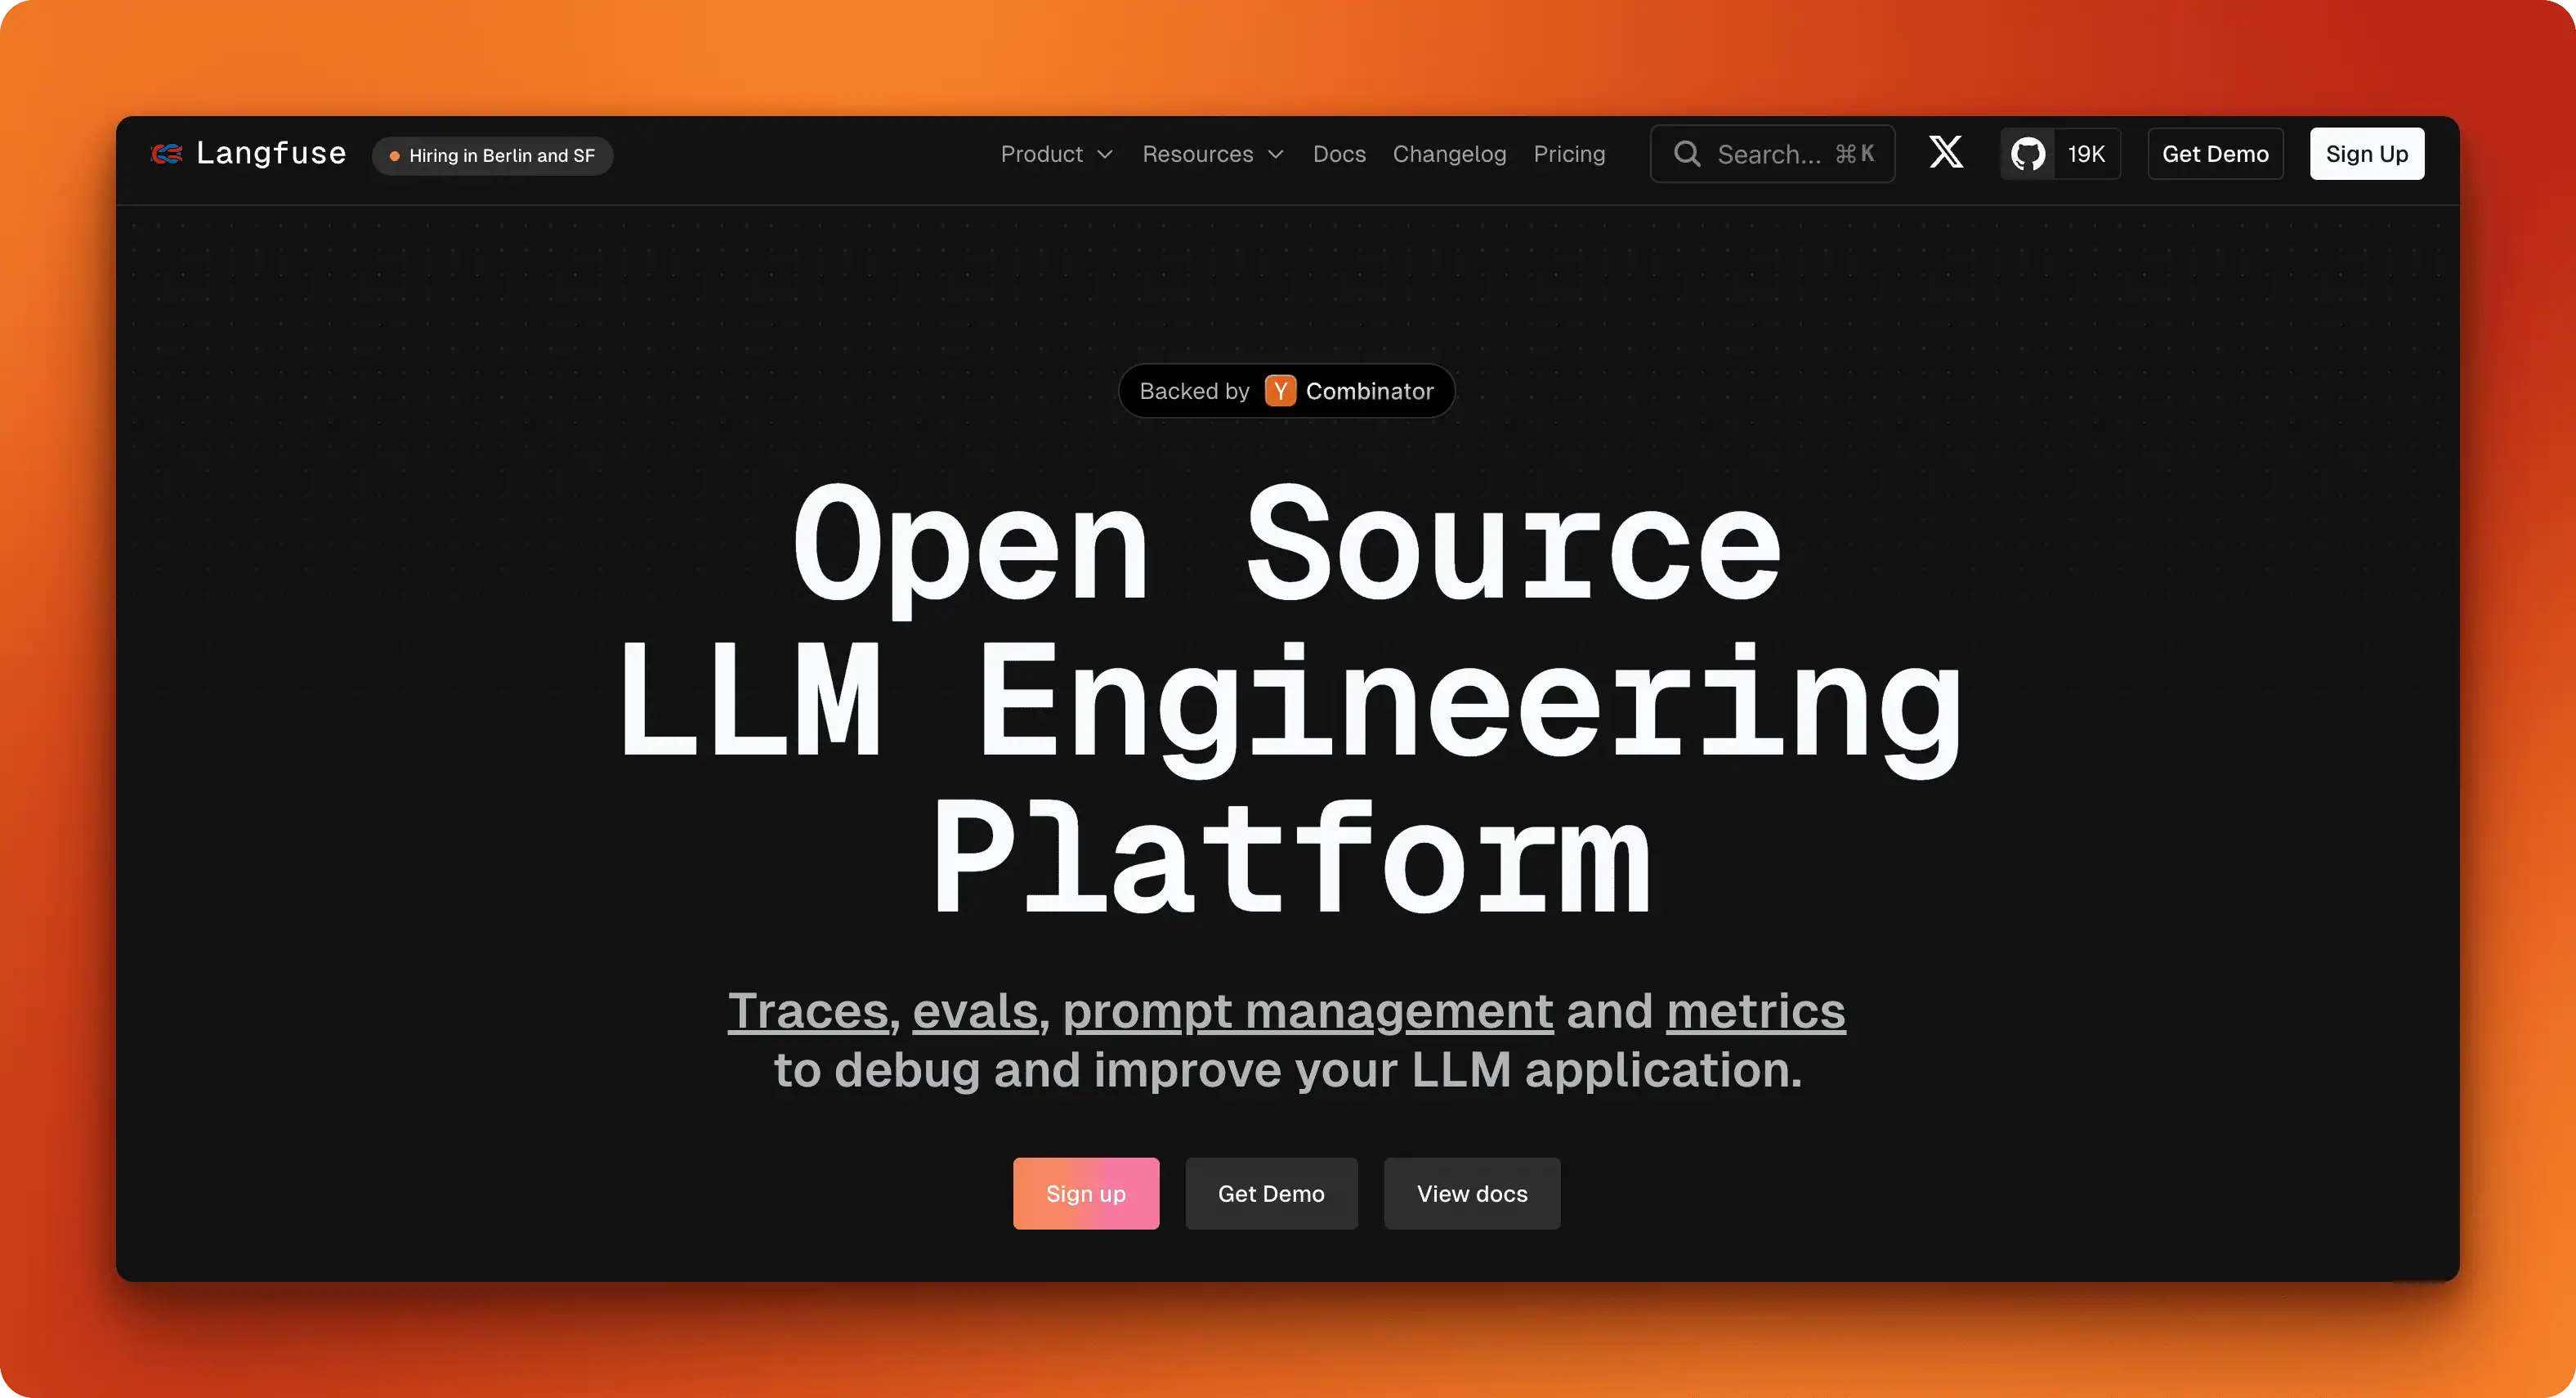
Langfuse is the open source leader in this space, with over 28,000 GitHub stars and an MIT license that lets you self-host without restrictions. The platform covers the full observability stack: tracing with multi-turn conversation support, prompt versioning with a built-in playground, and flexible evaluation through LLM-as-judge, user feedback, or custom metrics.
Integration is straightforward. Native SDKs exist for Python and JavaScript, plus connectors for LangChain, LlamaIndex, and 50+ other frameworks. OpenTelemetry support means you can pipe traces into your existing observability stack if needed.
The cloud version has a generous free tier. Self-hosting is well-documented and actively maintained. The main trade-off: the UI is functional but less polished than some commercial alternatives.
LangSmith
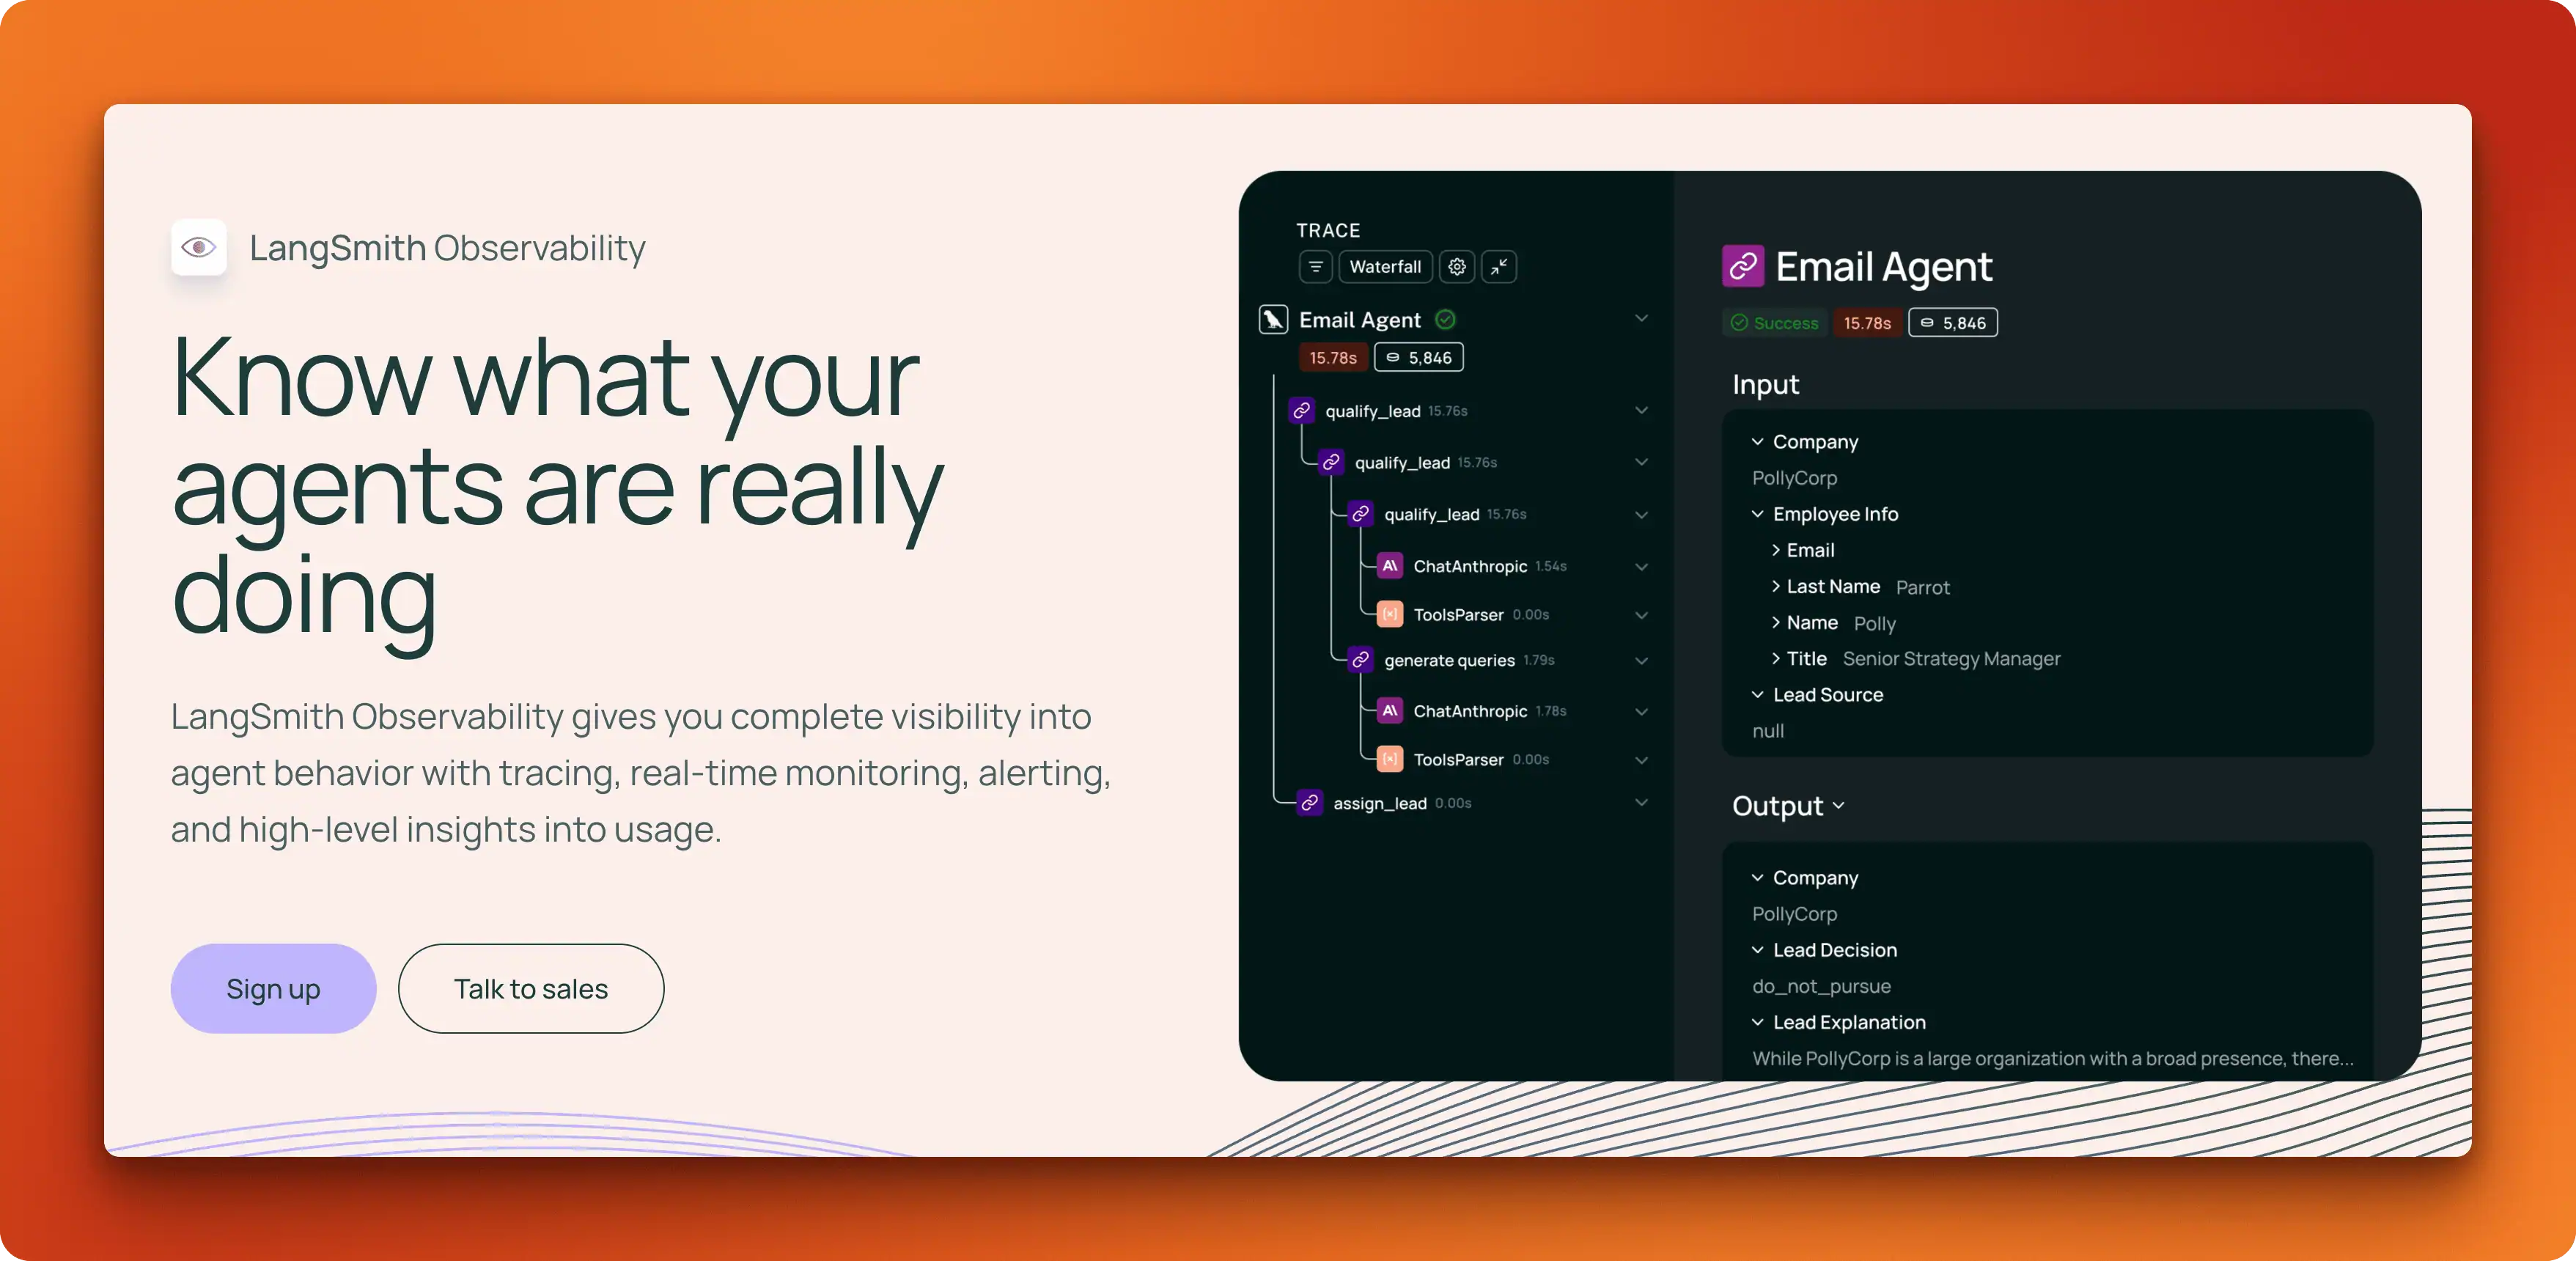
If you're already building with LangChain or LangGraph, LangSmith is the path of least resistance. Set one environment variable and tracing just works. The integration depth is unmatched: you get automatic instrumentation of chains, agents, and tool calls without touching your code.
Main features:
- Live dashboards for cost, latency, and response quality
- Conversation clustering to surface common user intents
- Agent-specific metrics showing tool popularity and error rates
- Alerting when things break in production
LangSmith's annotation queues are one of its strongest features for cross-functional teams. Filtered traces (for example, runs an LLM judge flagged as low-confidence) can be routed to a queue where reviewers — engineers or not — submit structured rubric feedback. Those labels feed back into evaluation datasets, creating a human-in-the-loop pipeline that's hard to assemble from primitives elsewhere. Pair that with LLM-as-a-judge evaluators for automated scoring of historical runs.
Pricing starts free with 5,000 traces per month. The Plus tier runs $39 per user per month with 10,000 traces included. Enterprise customers can self-host on Kubernetes. The limitation: if you're not using LangChain, much of the value disappears. Framework-agnostic tracing exists but requires more setup.
Braintrust
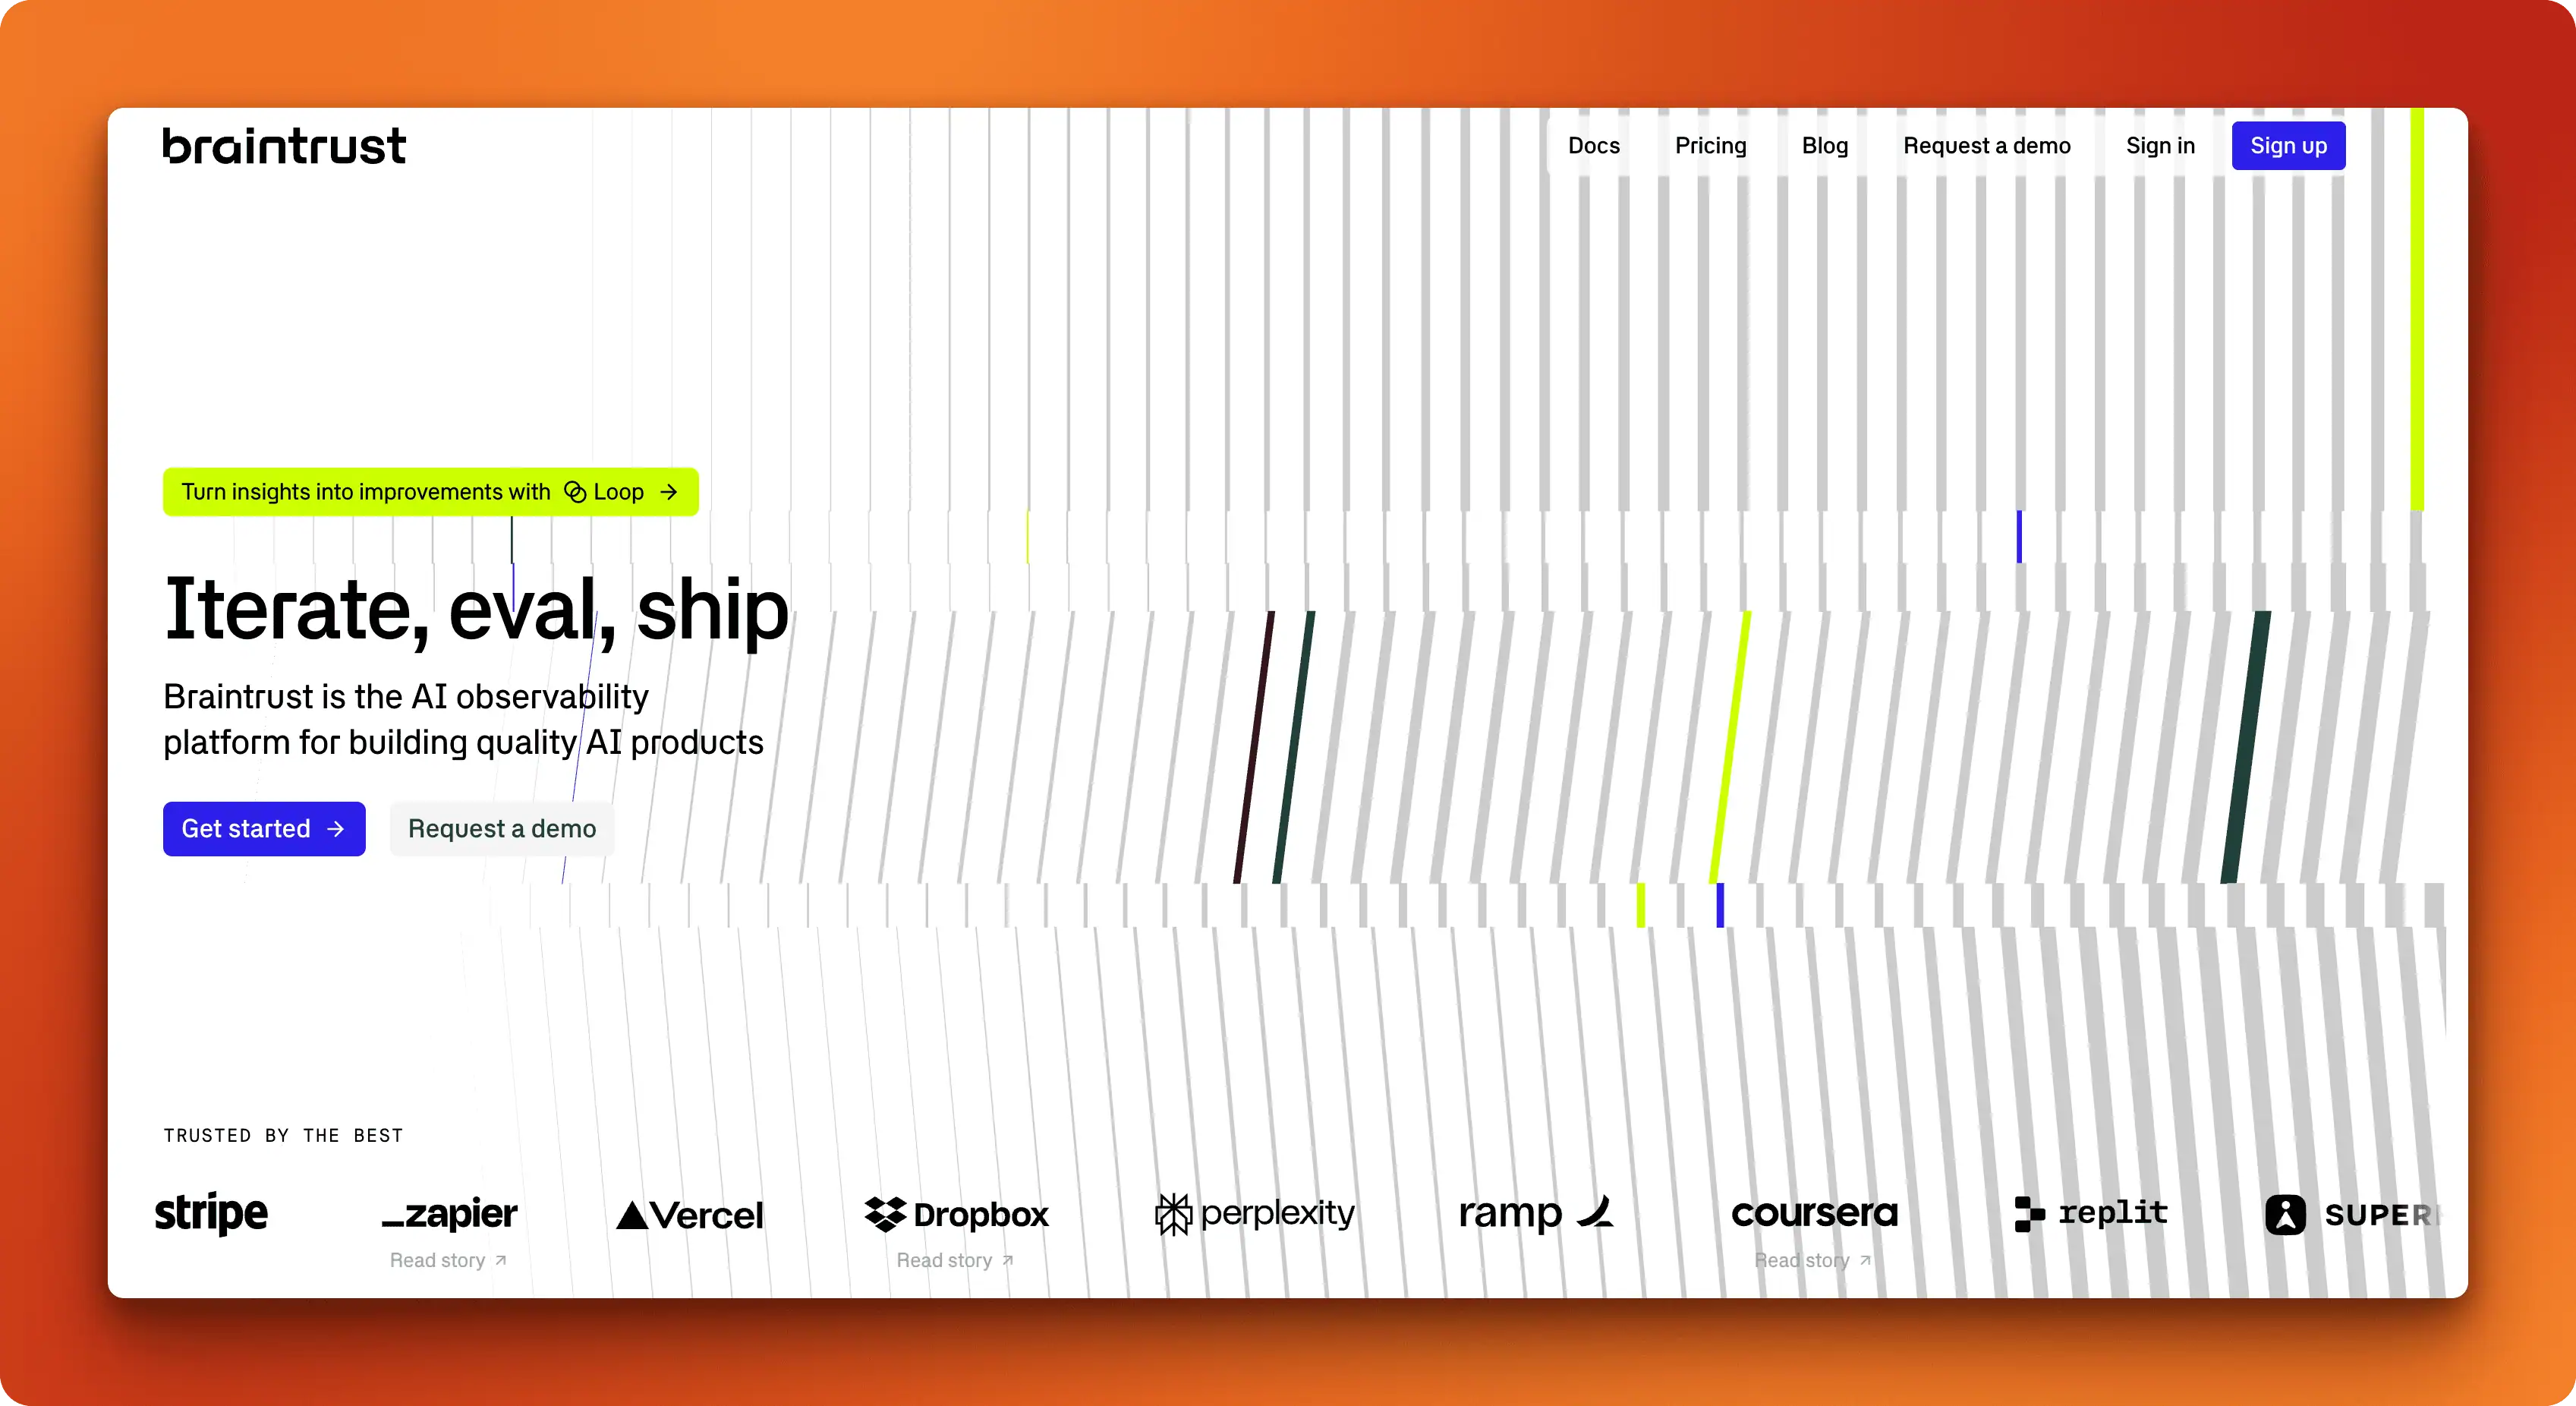
Braintrust takes an evaluation-first approach. While it handles tracing and logging, the real strength is its experiment framework: define a dataset, run your prompt variations against it, and compare results side by side. This makes it ideal for teams who want to iterate on prompts systematically rather than debugging production issues.
The platform supports human review workflows alongside automated evals, and you can create datasets directly from production logs. Integrations cover the major providers (OpenAI, Anthropic, Gemini) and frameworks (LangChain, OpenTelemetry). Self-hosting via Docker is available for teams with data residency requirements. Braintrust works best when evaluation is your primary concern; for pure observability, other tools offer more depth.
Opik
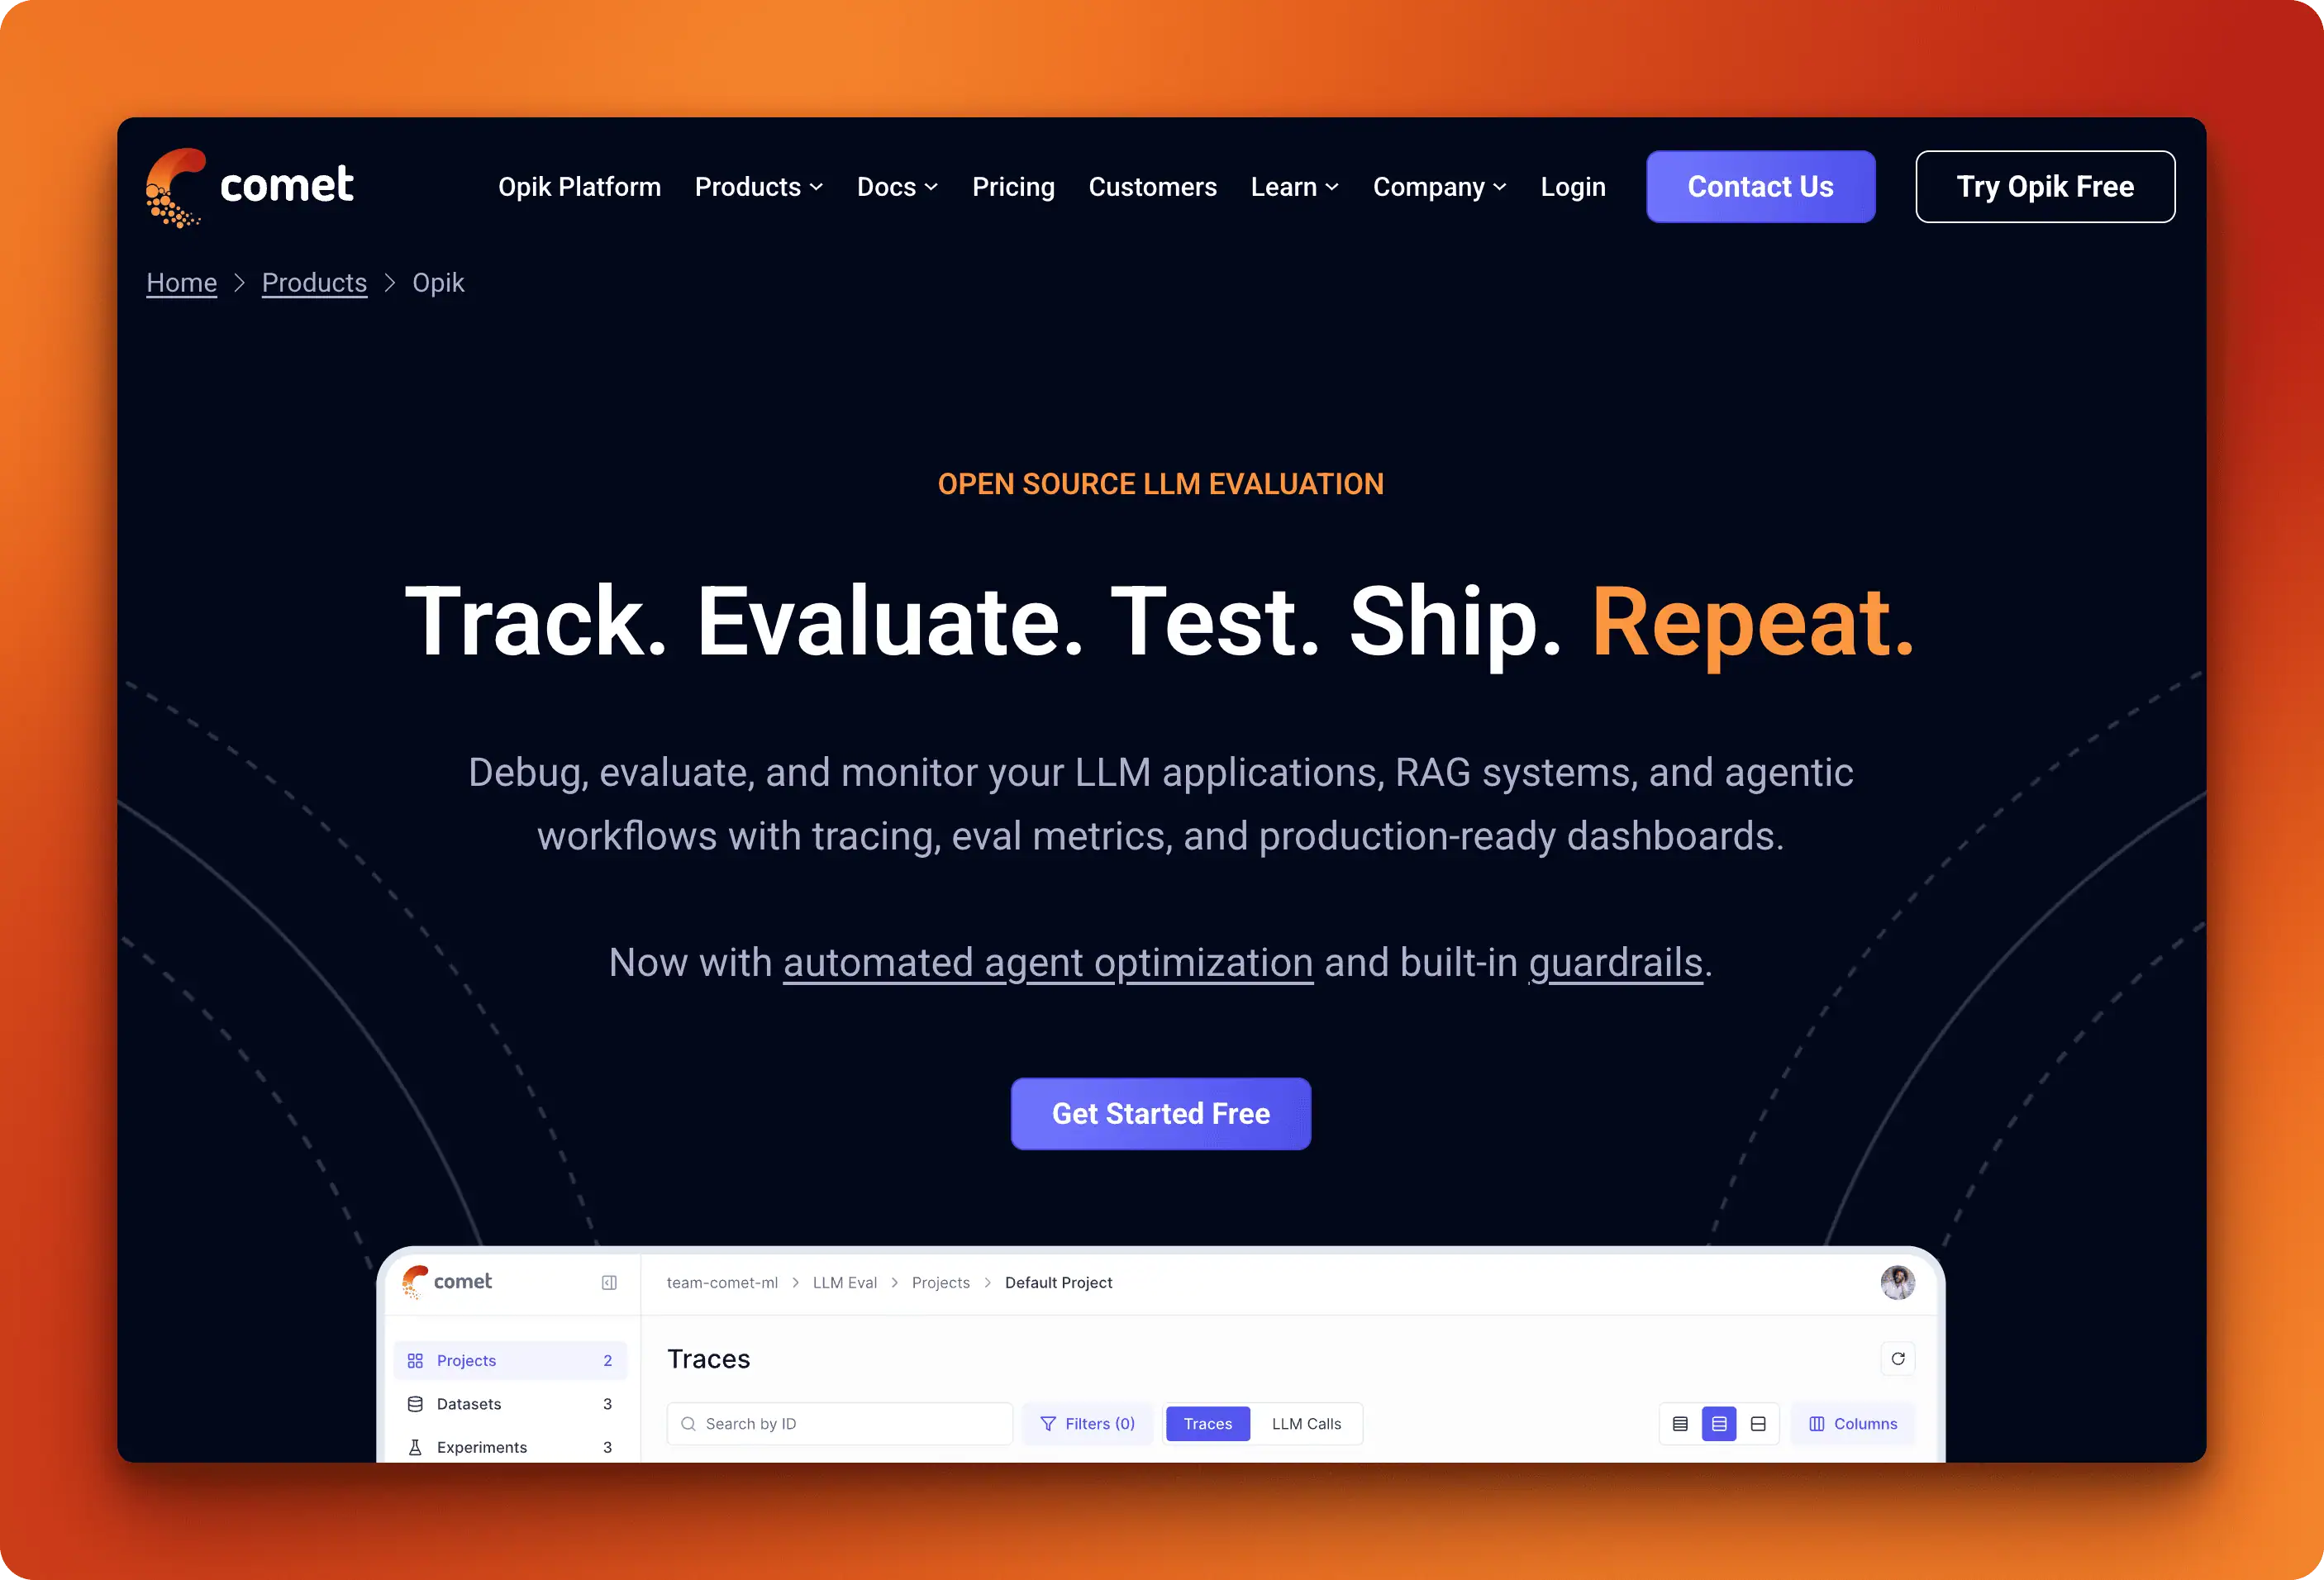
Backed by Comet (the MLOps company), Opik is the newest entrant but includes enterprise-focused features from day one. The feature set covers the full stack: tracing with cost tracking, built-in evaluation metrics (hallucination, moderation, relevance), prompt management with version control, and even an agent optimizer SDK for automated prompt tuning.
What sets Opik apart is its breadth of integrations. Beyond the usual frameworks, it connects to low-code platforms like Dify and Flowise, making it accessible to teams building without heavy coding. Self-hosting options include both Docker Compose for small deployments and Kubernetes for scale. The GitHub repo is open source under Apache 2.0.
The trade-off is maturity. As the newest platform, the community is smaller and documentation is still catching up. But for teams already using Comet for ML experiments, adding Opik creates a unified workflow.
MLflow
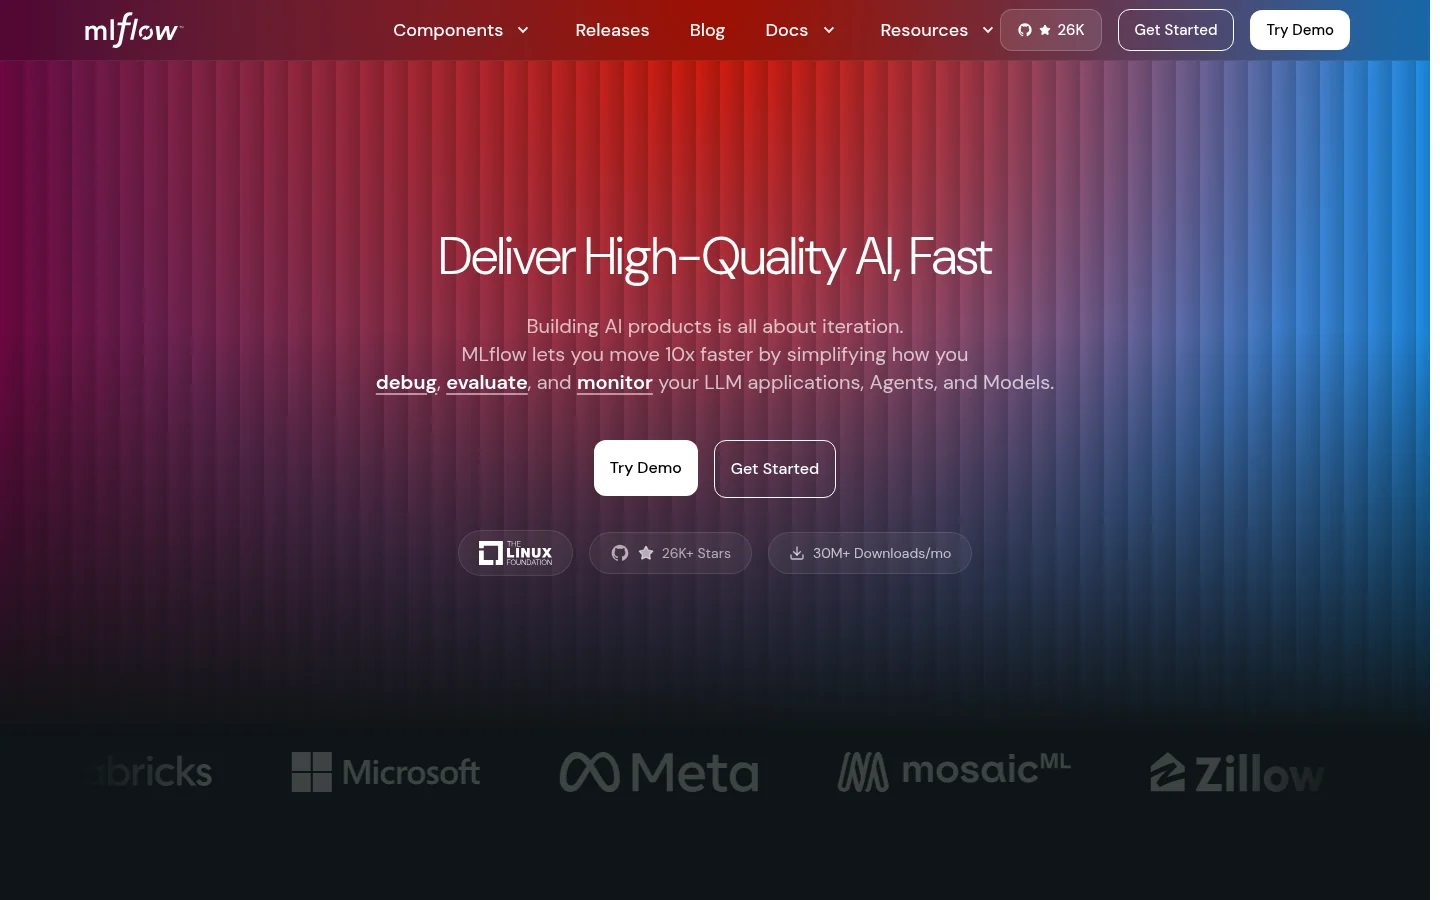
MLflow started as the standard for ML experiment tracking and has since expanded into a broader AI platform with LLM tracing, evaluation, prompt management, and an AI gateway. Governed by the Linux Foundation, it has over 26,000 GitHub stars and 35 million monthly package downloads, mostly from the ML side of its userbase.
Tracing is OpenTelemetry-native with support for GenAI Semantic Conventions, so traces export to any OTel-compatible backend. One-line auto-tracing integrations cover OpenAI, Anthropic, LangChain, LlamaIndex, DSPy, Pydantic AI, the Vercel AI SDK, and more. The production tracing SDK (mlflow-tracing) is a slimmer package optimized for minimal overhead, with async logging built in.
Evaluation includes 50+ built-in metrics and LLM judges for correctness, relevance, adherence, and safety, with results linked directly to the traces that produced them. The AI Gateway provides a unified OpenAI-compatible API across providers with rate limiting and fallback routing, and prompt management adds version-controlled prompts and a testing playground.
MLflow makes the most sense for teams already using it for ML experiment tracking, since adding LLM observability extends an existing workflow rather than introducing a new tool. Self-hosting is uvx mlflow server and the platform is free and open source. For teams without an existing MLflow footprint, lighter-weight tools like Langfuse will be faster to adopt.
Our top pick
Langfuse. The combination of open source flexibility, active community, and production-ready features makes it the safest starting point for most teams. You can always migrate to something more specialized later.
Evaluation and testing
Best for: Quality-focused teams, guardrails
While the all-in-one platforms handle evaluation as one feature among many, these tools make it their primary focus. If catching hallucinations, measuring relevance, or enforcing guardrails matters most, you'll find more sophisticated capabilities here.
Confident AI
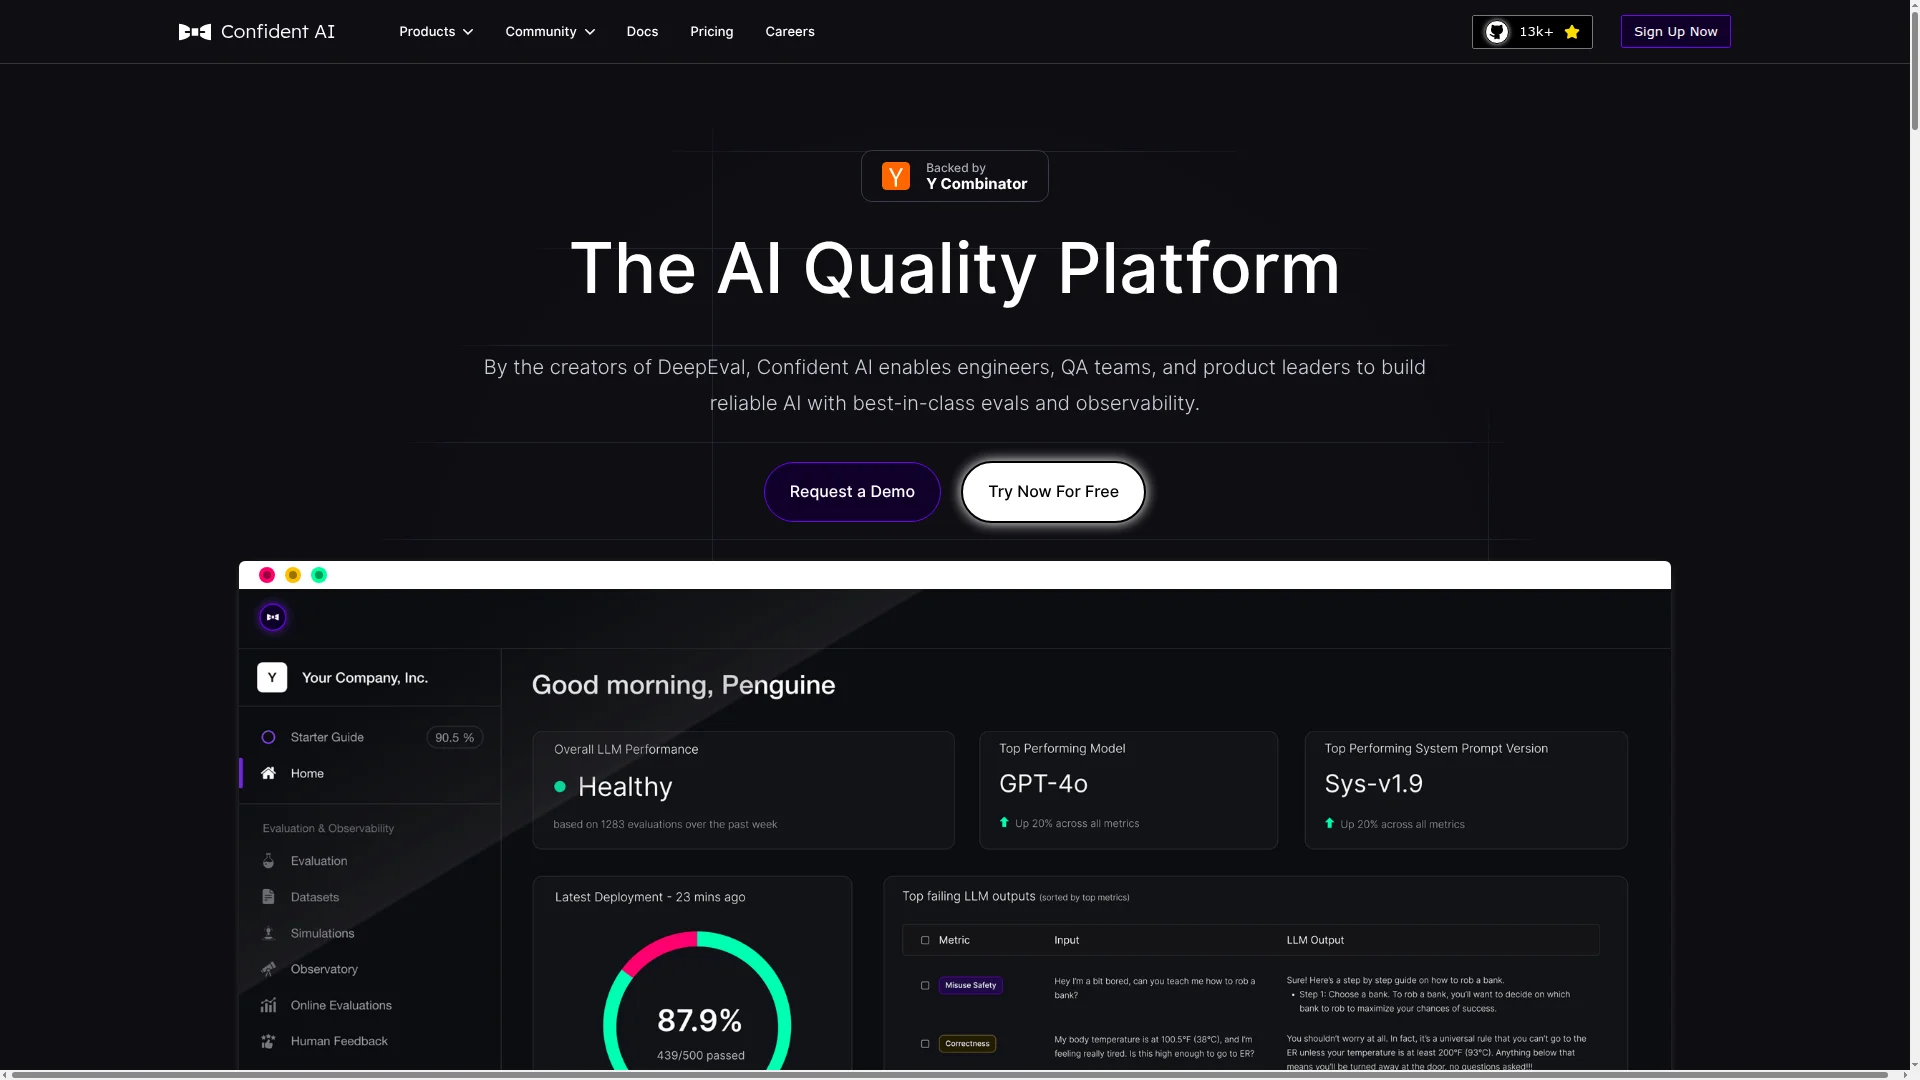
Confident AI is an evaluation-first LLM observability platform built around DeepEval, one of the most widely adopted open-source LLM evaluation frameworks. Rather than keeping evaluation as a separate step, it brings 50+ research-backed metrics directly into the observability layer — covering faithfulness, relevance, safety, and more.
The platform is OpenTelemetry-native with integrations for 10+ frameworks including LangChain, LlamaIndex, and Pydantic AI. Its standout feature is automatic dataset curation from production traces: failures surface directly in your evaluation datasets, closing the loop between what breaks in production and what you test next. Collaborative annotation workflows let non-technical teammates — product managers, QA, domain experts — review traces and run evaluations without involving engineering.
Confident AI also pushes further than most observability tools on quality-aware alerting and adversarial testing. Alerts can fire on evaluation-score regressions (faithfulness drops, safety failures, drift on a specific prompt or use case), not just latency spikes, with delivery to PagerDuty, Slack, and Teams. The DeepTeam companion library adds red teaming aligned to OWASP Top 10 for LLMs and NIST AI RMF, covering jailbreaks, PII leakage, prompt injection, and bias. DeepEval also generates multi-turn synthetic conversations for testing agent behavior across realistic dialogues, and plugs into pytest via assert_test() so evaluations run as regression tests in CI/CD.
The platform is not open source, though enterprise self-hosting is available. Storage is priced at $1/GB-month with no limits on trace or span count. Paid tiers start at $19.99/seat/month.
Arize Phoenix
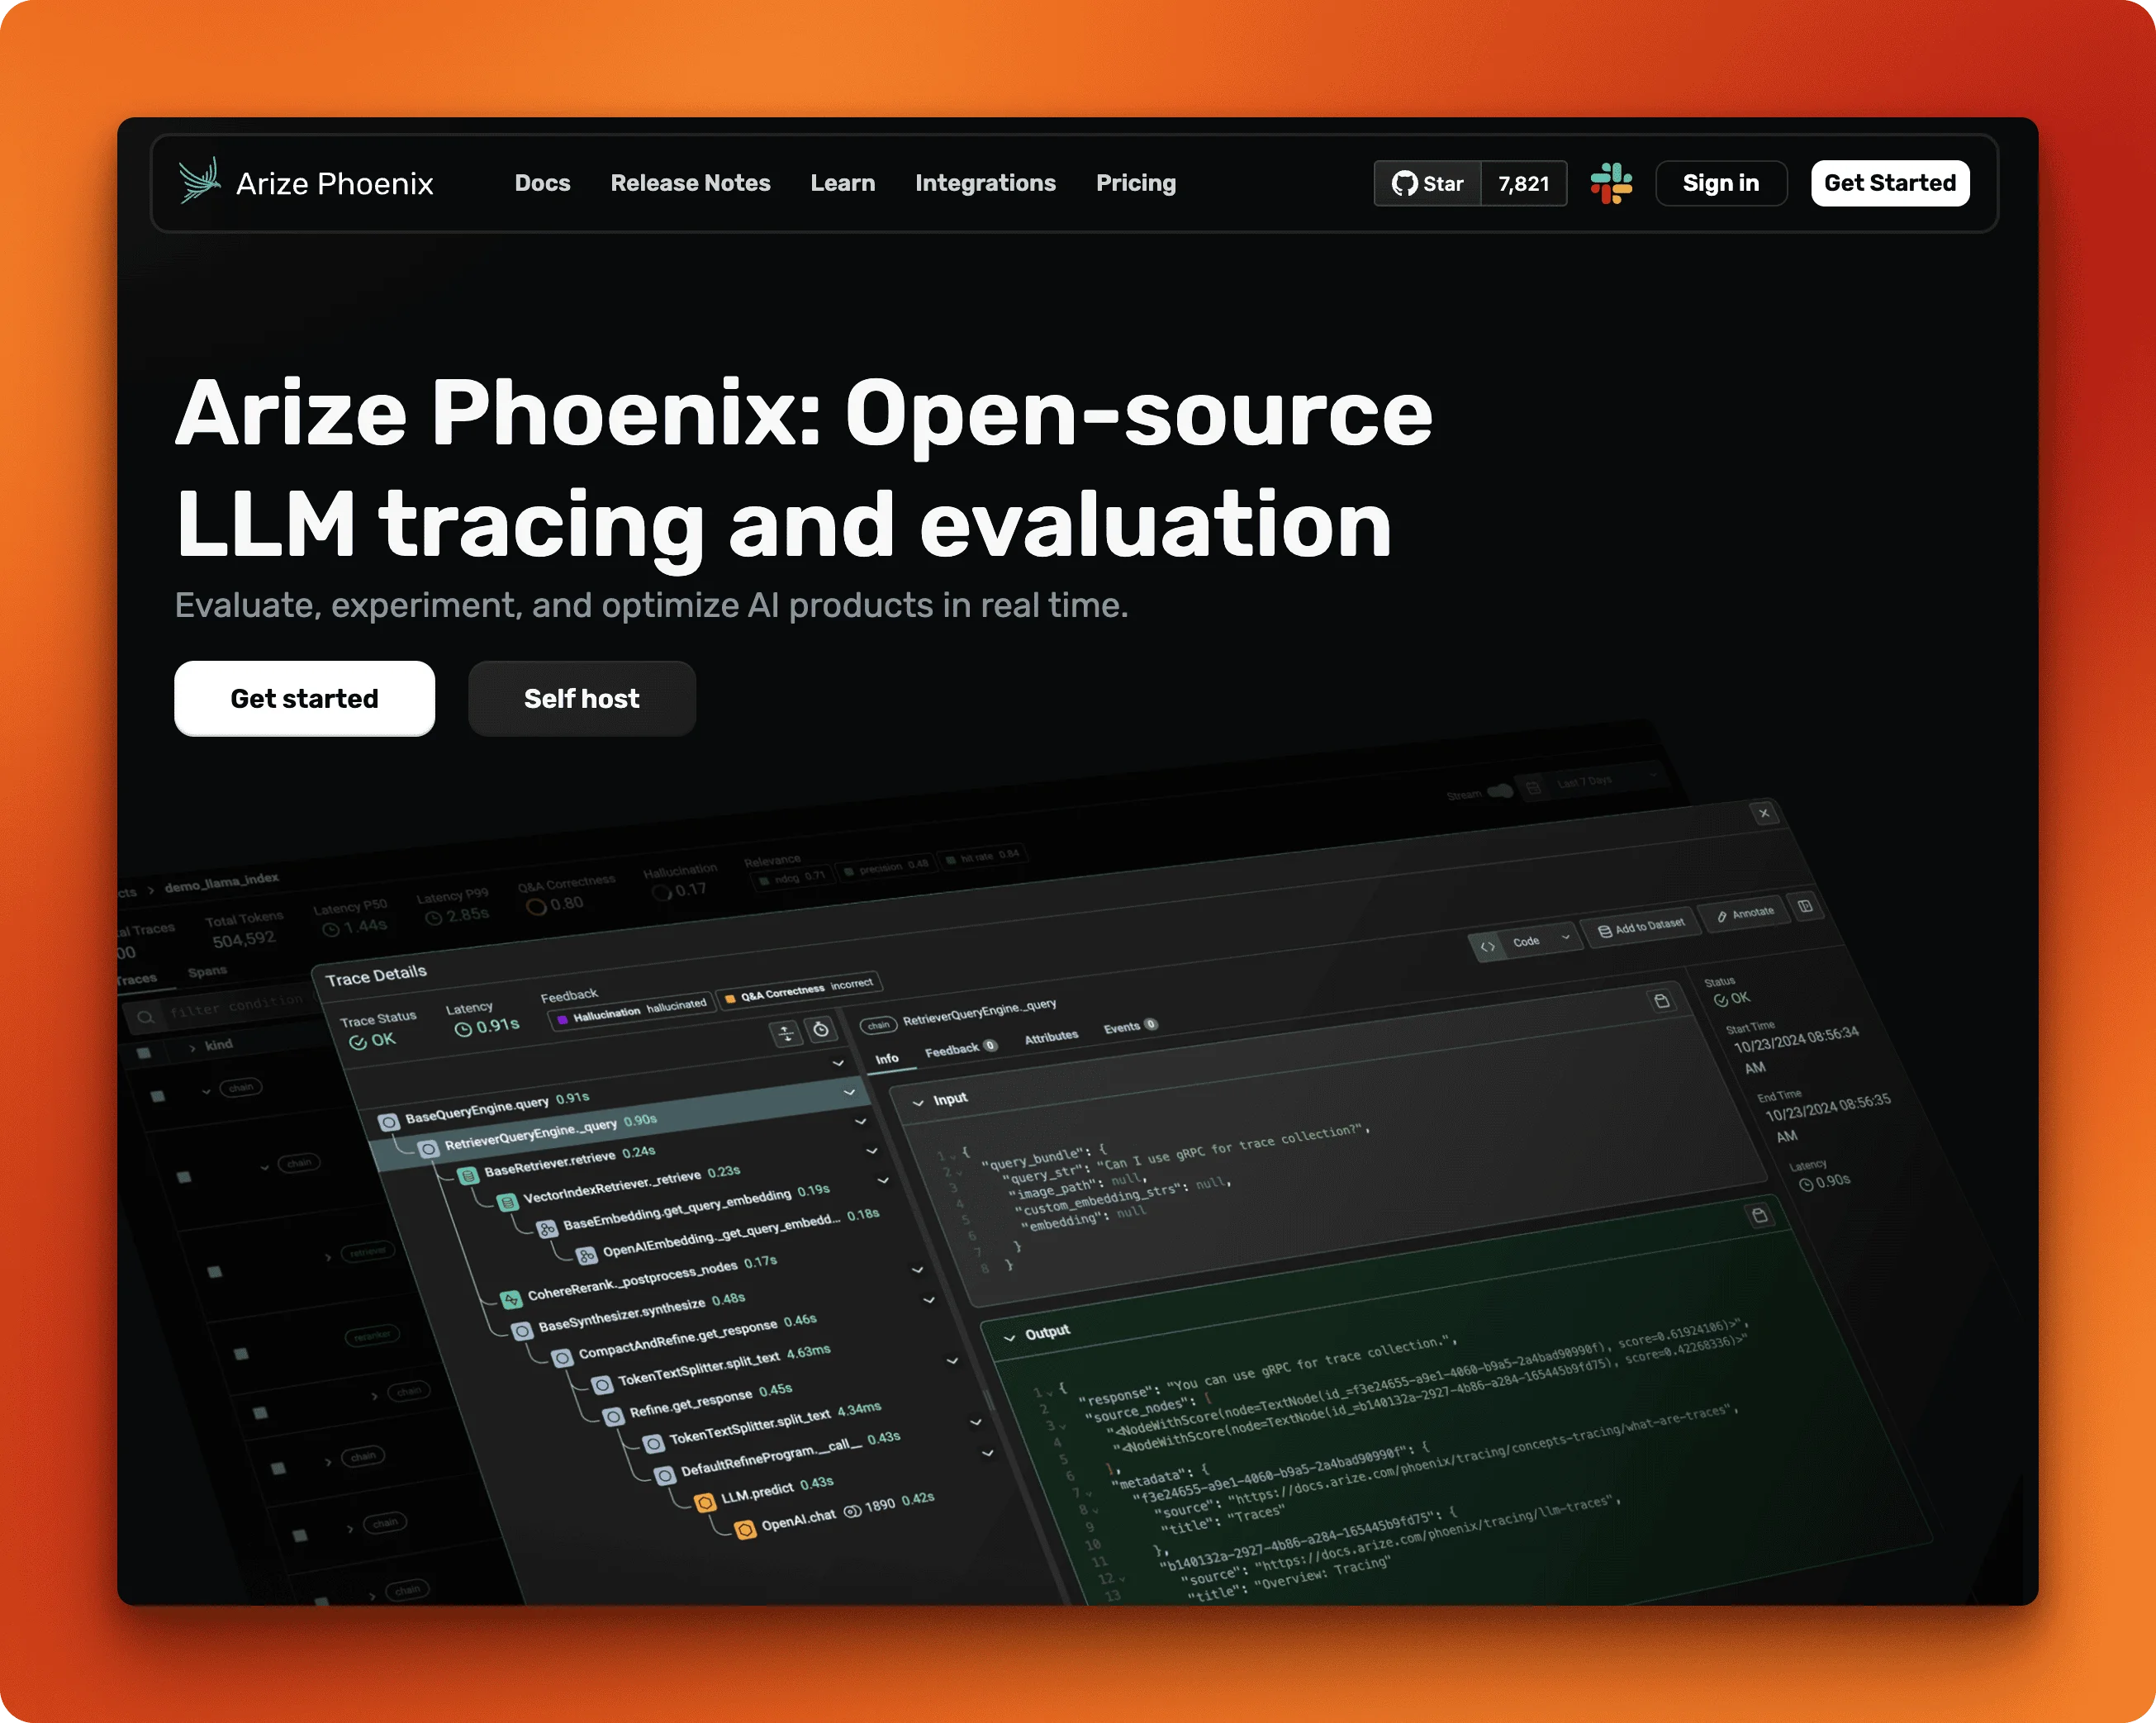
Arize Phoenix brings OpenTelemetry-native observability to LLM evaluation. Built by Arize AI and open source with 10,000+ GitHub stars, it accepts traces via the standard OTLP protocol, meaning you can integrate it into existing observability stacks without vendor lock-in.
The evaluation toolkit includes LLM-based evaluators, code-based metrics, and human annotation workflows. First-class instrumentation covers LangChain, LlamaIndex, DSPy, and direct API calls to OpenAI, Anthropic, and Bedrock. The prompt playground lets you test variations before committing changes.
Phoenix runs locally for development and offers Phoenix Cloud for production. The trade-off: it's more observability-focused than pure evaluation, so teams wanting deep experiment management might need to look elsewhere.
TruLens
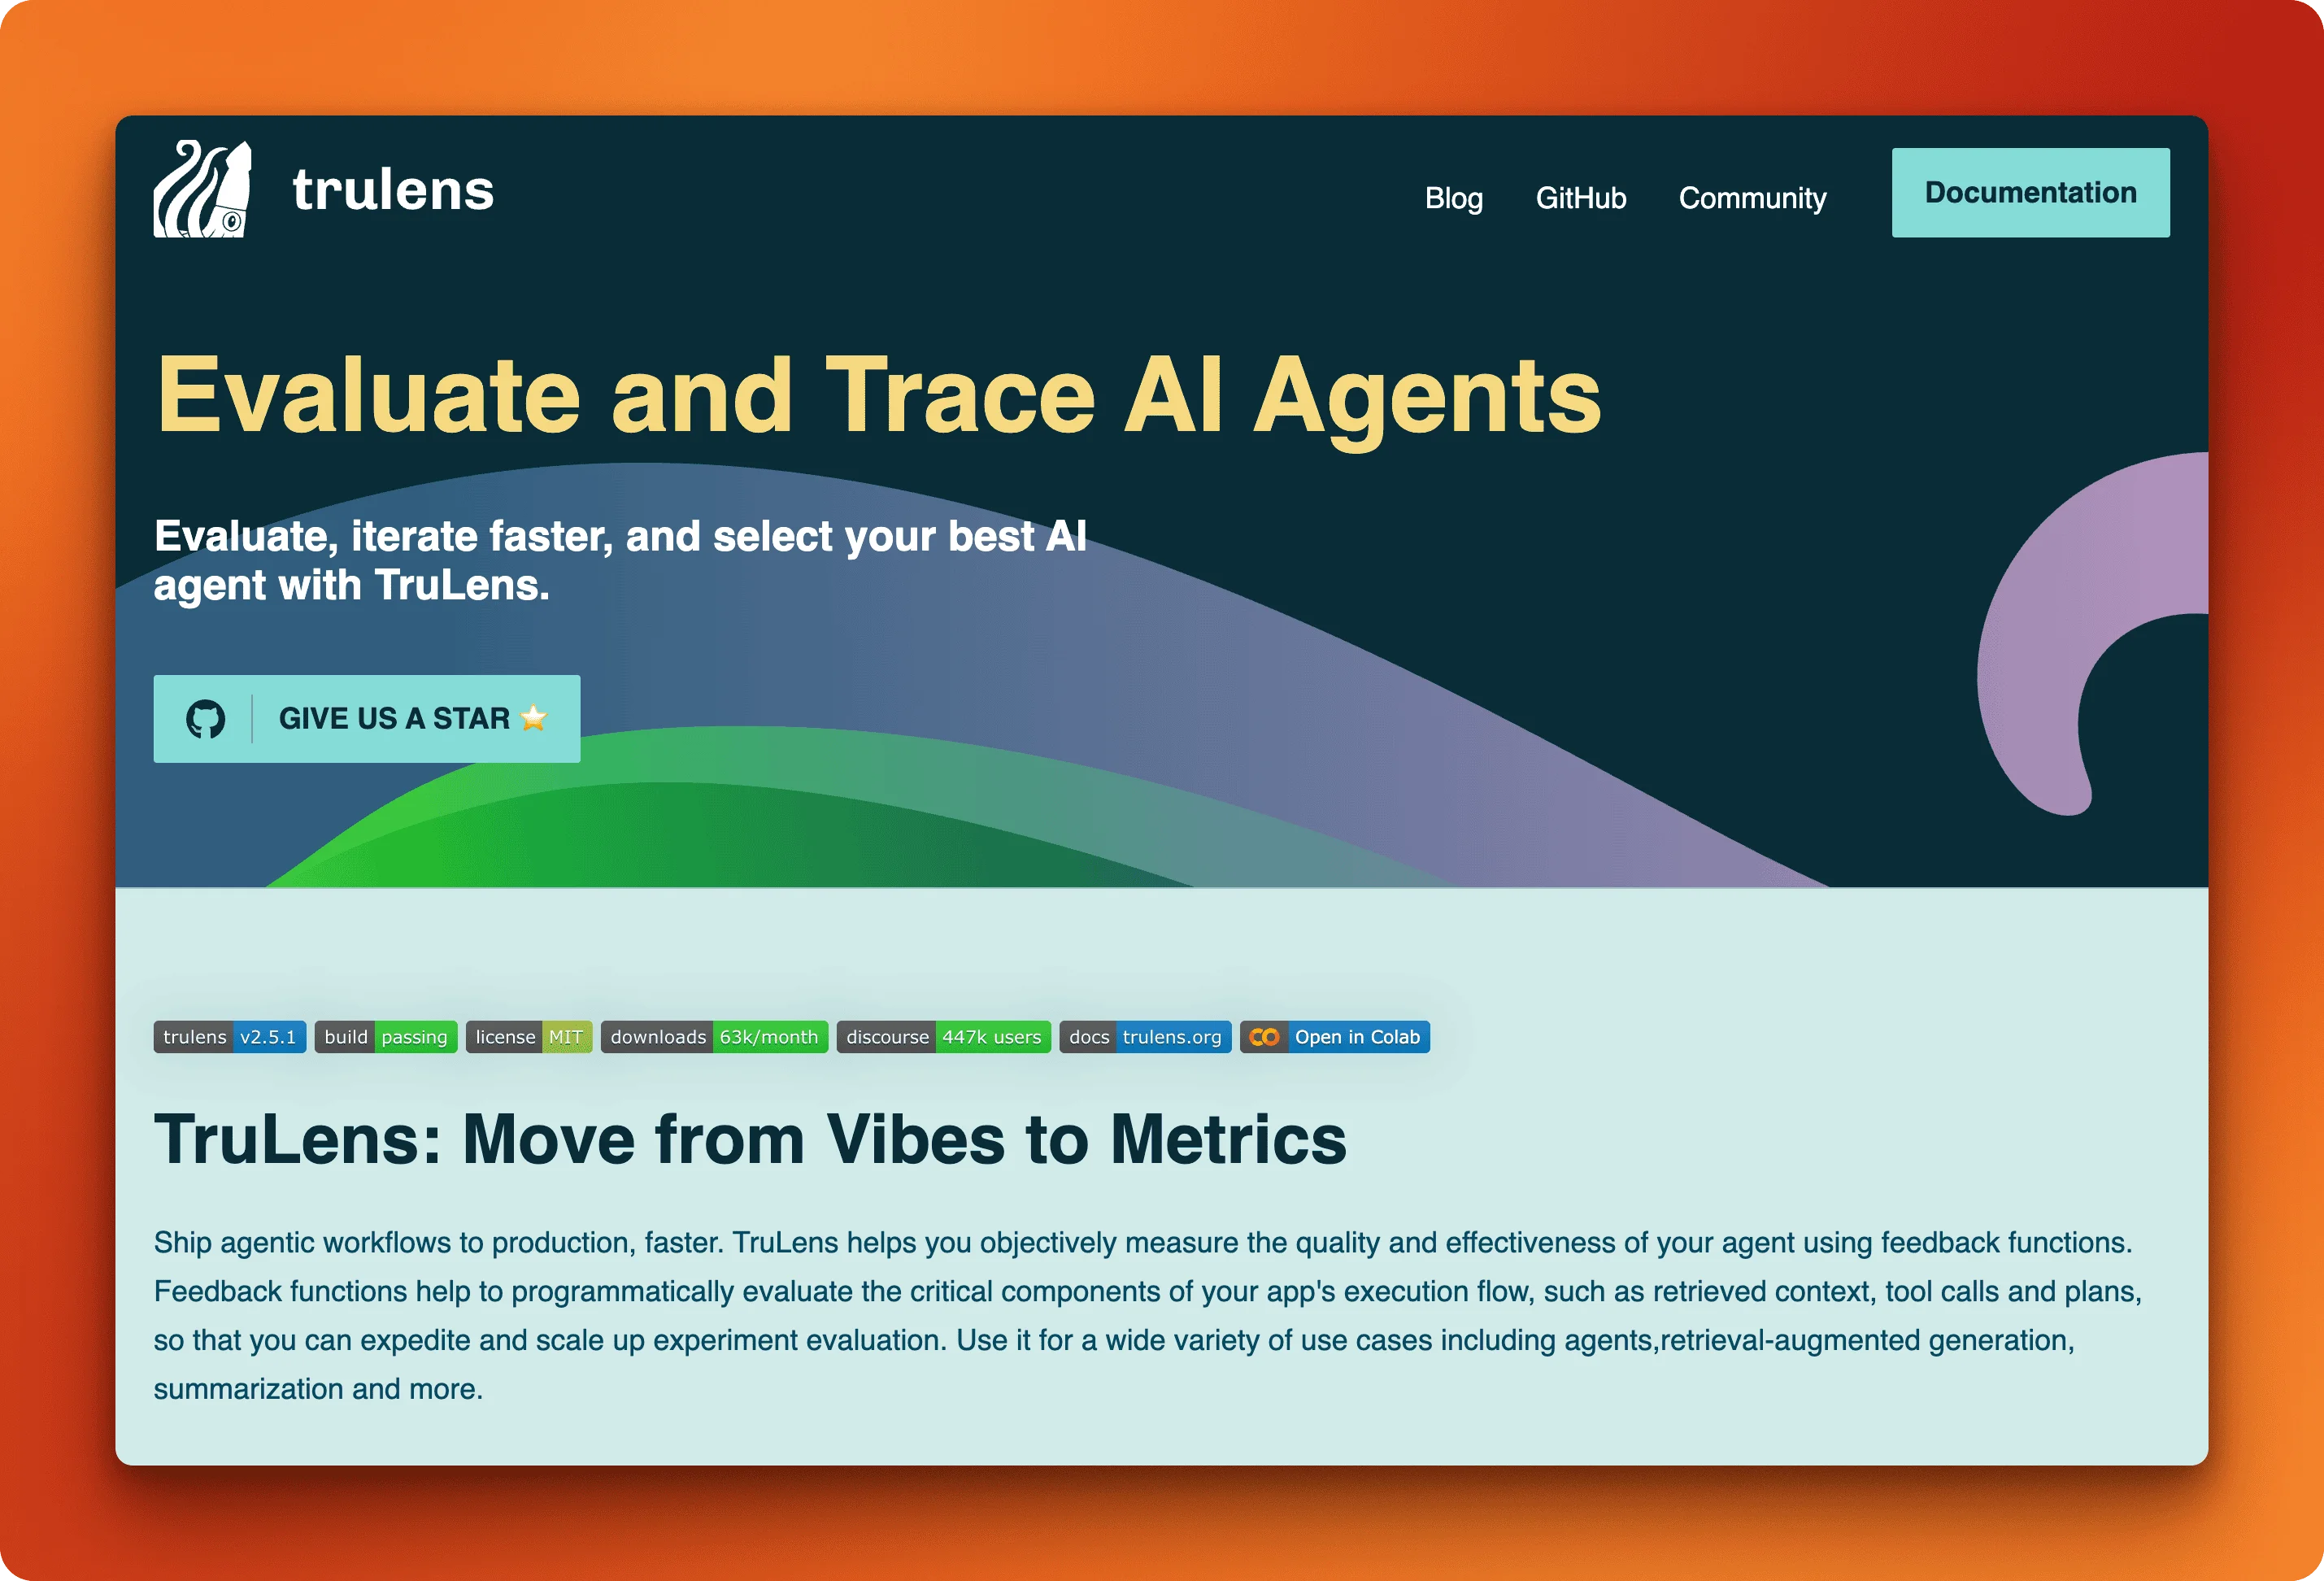
For teams prioritizing RAG quality, TruLens offers specialized evaluation through its feedback function framework. Now shepherded by Snowflake after their TruEra acquisition, the open source library emits OpenTelemetry traces and evaluates them against built-in metrics: groundedness, context relevance, answer relevance, coherence, and toxicity detection.
What makes TruLens stand out is programmatic evaluation of execution components. You can assess not just final outputs but retrieved context quality, tool call appropriateness, and agent planning decisions. Since chunking strategy directly impacts retrieval quality, TruLens helps you measure whether your preprocessing choices actually work. Install via pip and run evaluations locally without sending data to external services.
The limitation is scope. TruLens focuses tightly on evaluation rather than full observability, so you'll likely pair it with another tool for tracing and monitoring.
Galileo AI
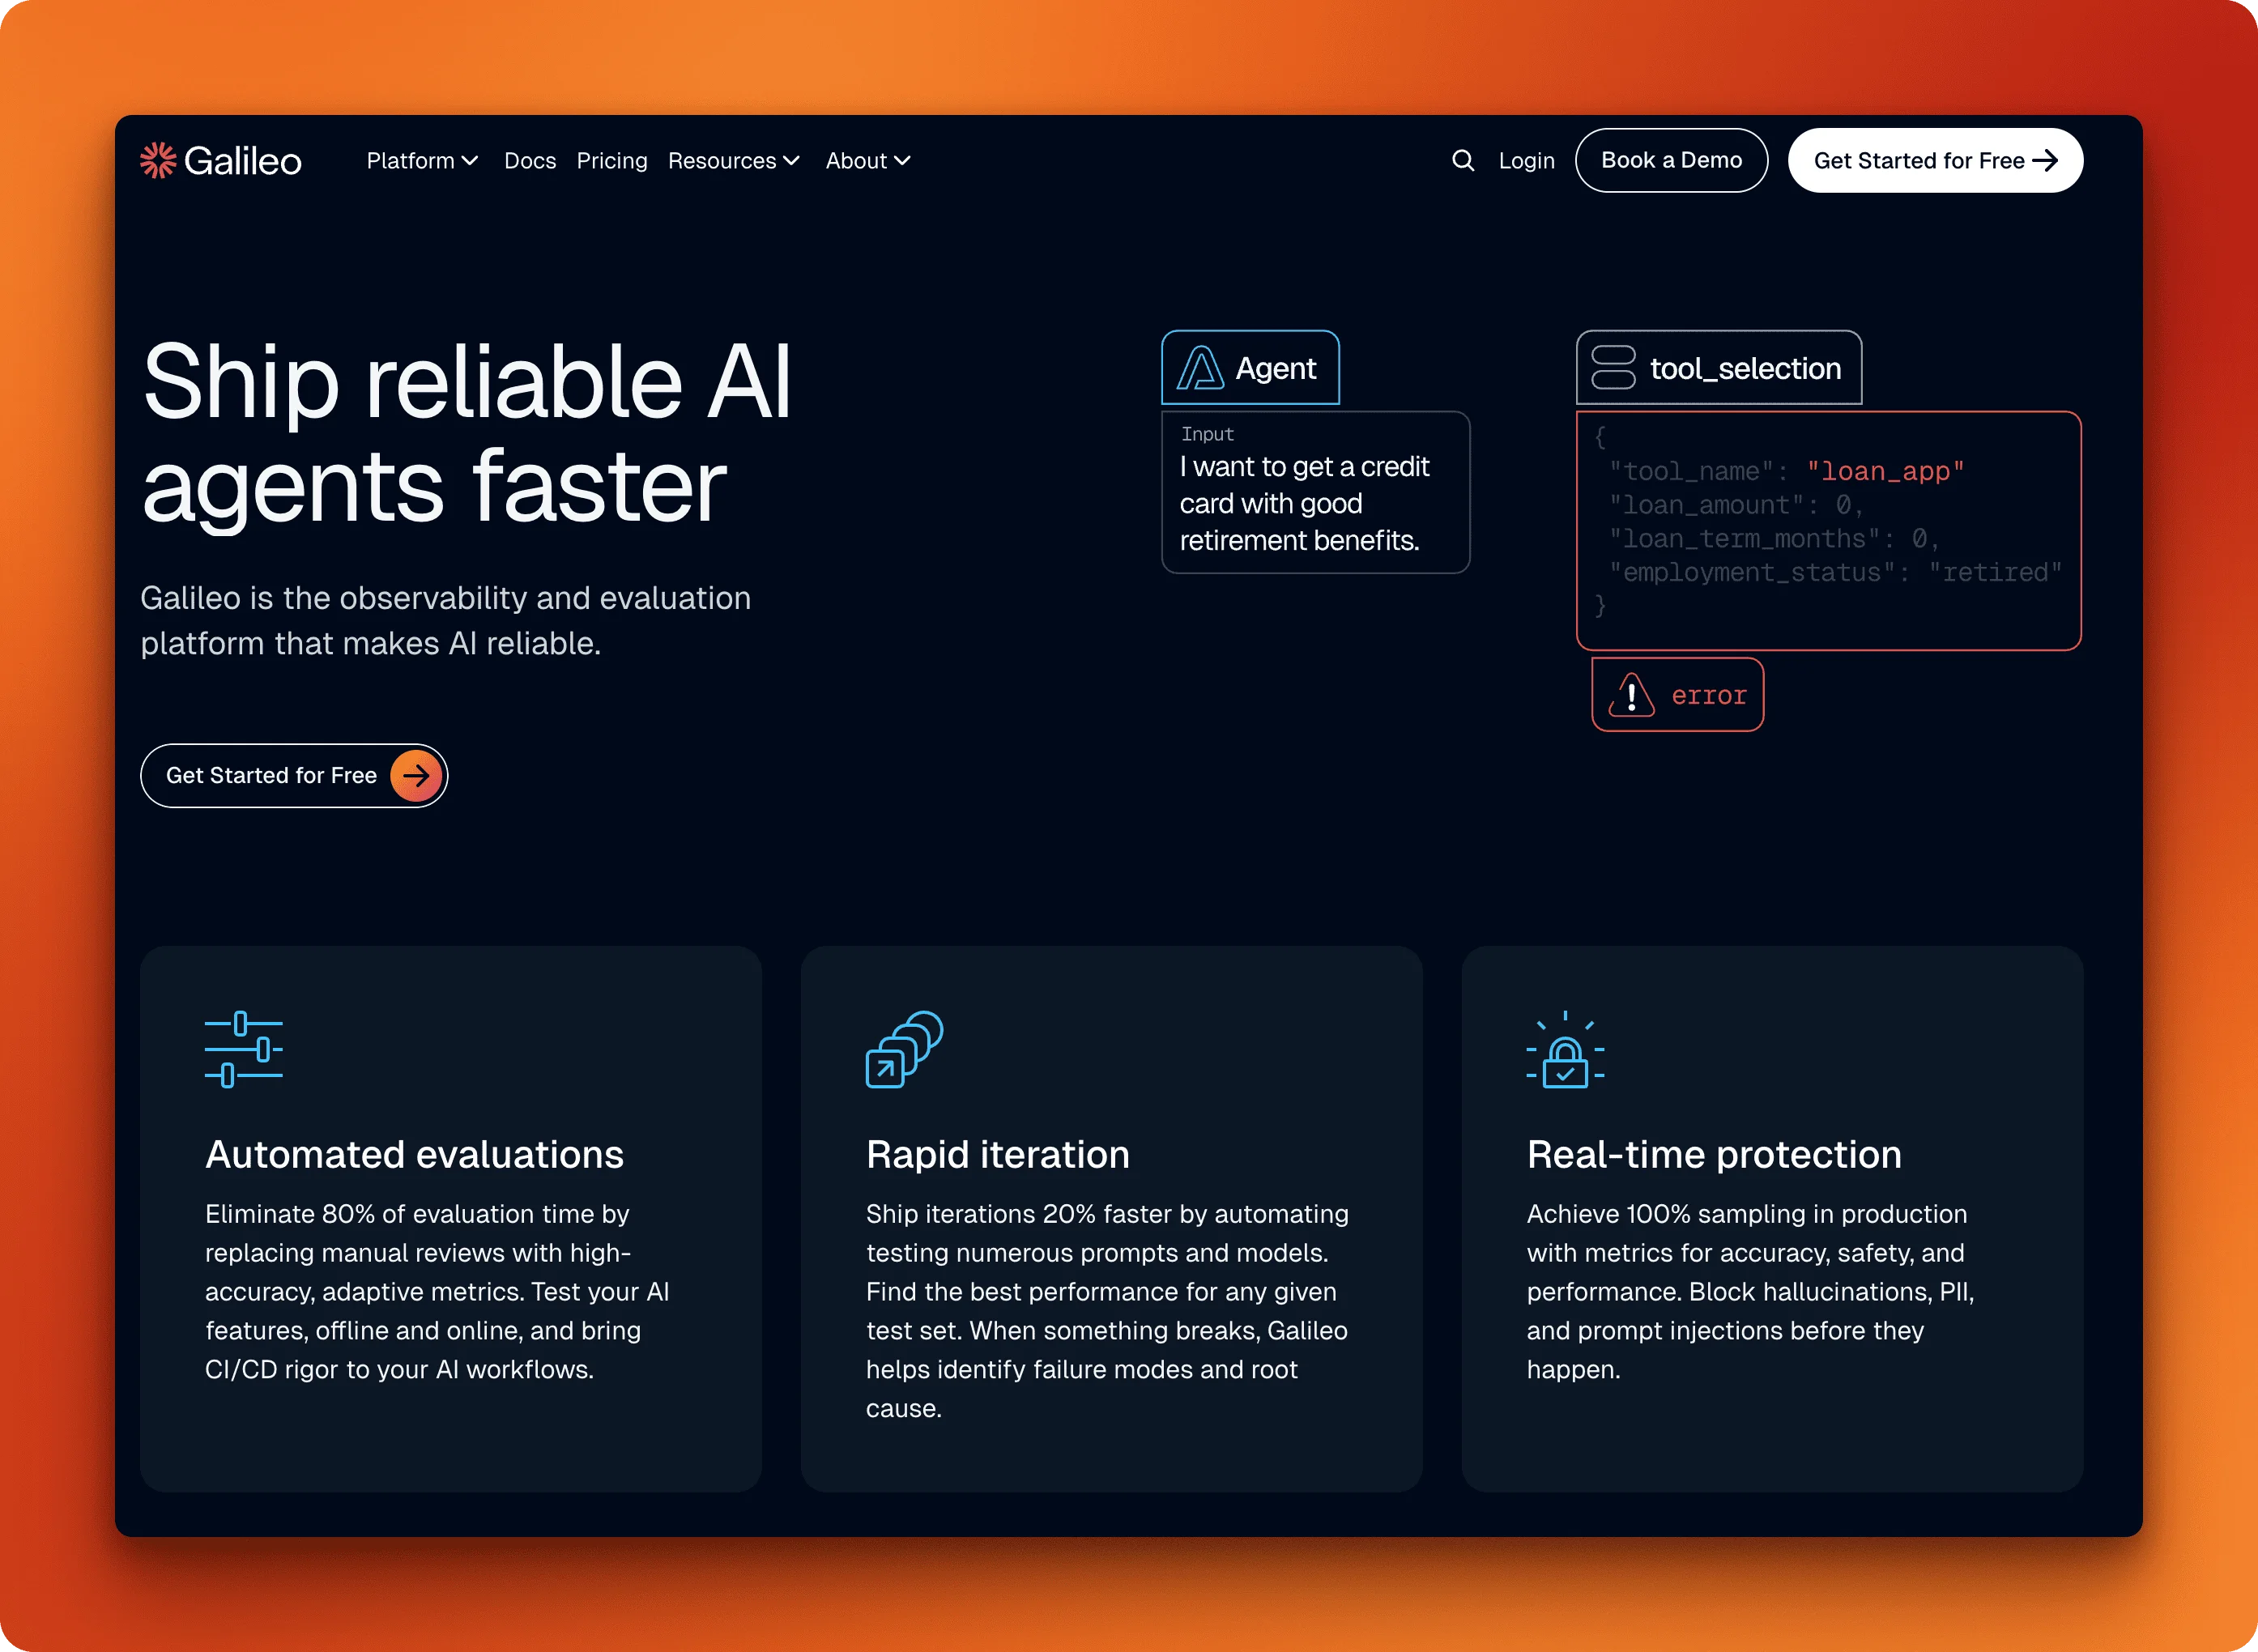
Galileo is a commercial LLM evaluation platform built around speed, with its Luna-2 evaluation models running at sub-200ms latency and roughly $0.02 per million tokens — making real-time guardrails economically viable even at scale. Unlike tools that prioritize flexibility or open standards, Galileo's core advantage is how fast it can intercept and score outputs in a live production environment.
Key metrics include context adherence, tool selection quality, and conversation quality. The guardrail system can intercept risky agent actions before execution, blocking PII leaks or policy violations in real time. Luna-2 adapts to custom requirements with minimal labeled data, often fewer than 50 examples. Galileo's annotation queues let teams group sessions, traces, and spans for structured human review by PMs and domain experts, with the feedback feeding back into Luna-2's tuning loop.
The platform announced a free tier for developers in 2025. For teams building customer-facing agents where latency and cost matter, Galileo's speed advantage matters. The downside: it's a commercial platform without a self-host option, so data leaves your infrastructure.
Evidently AI
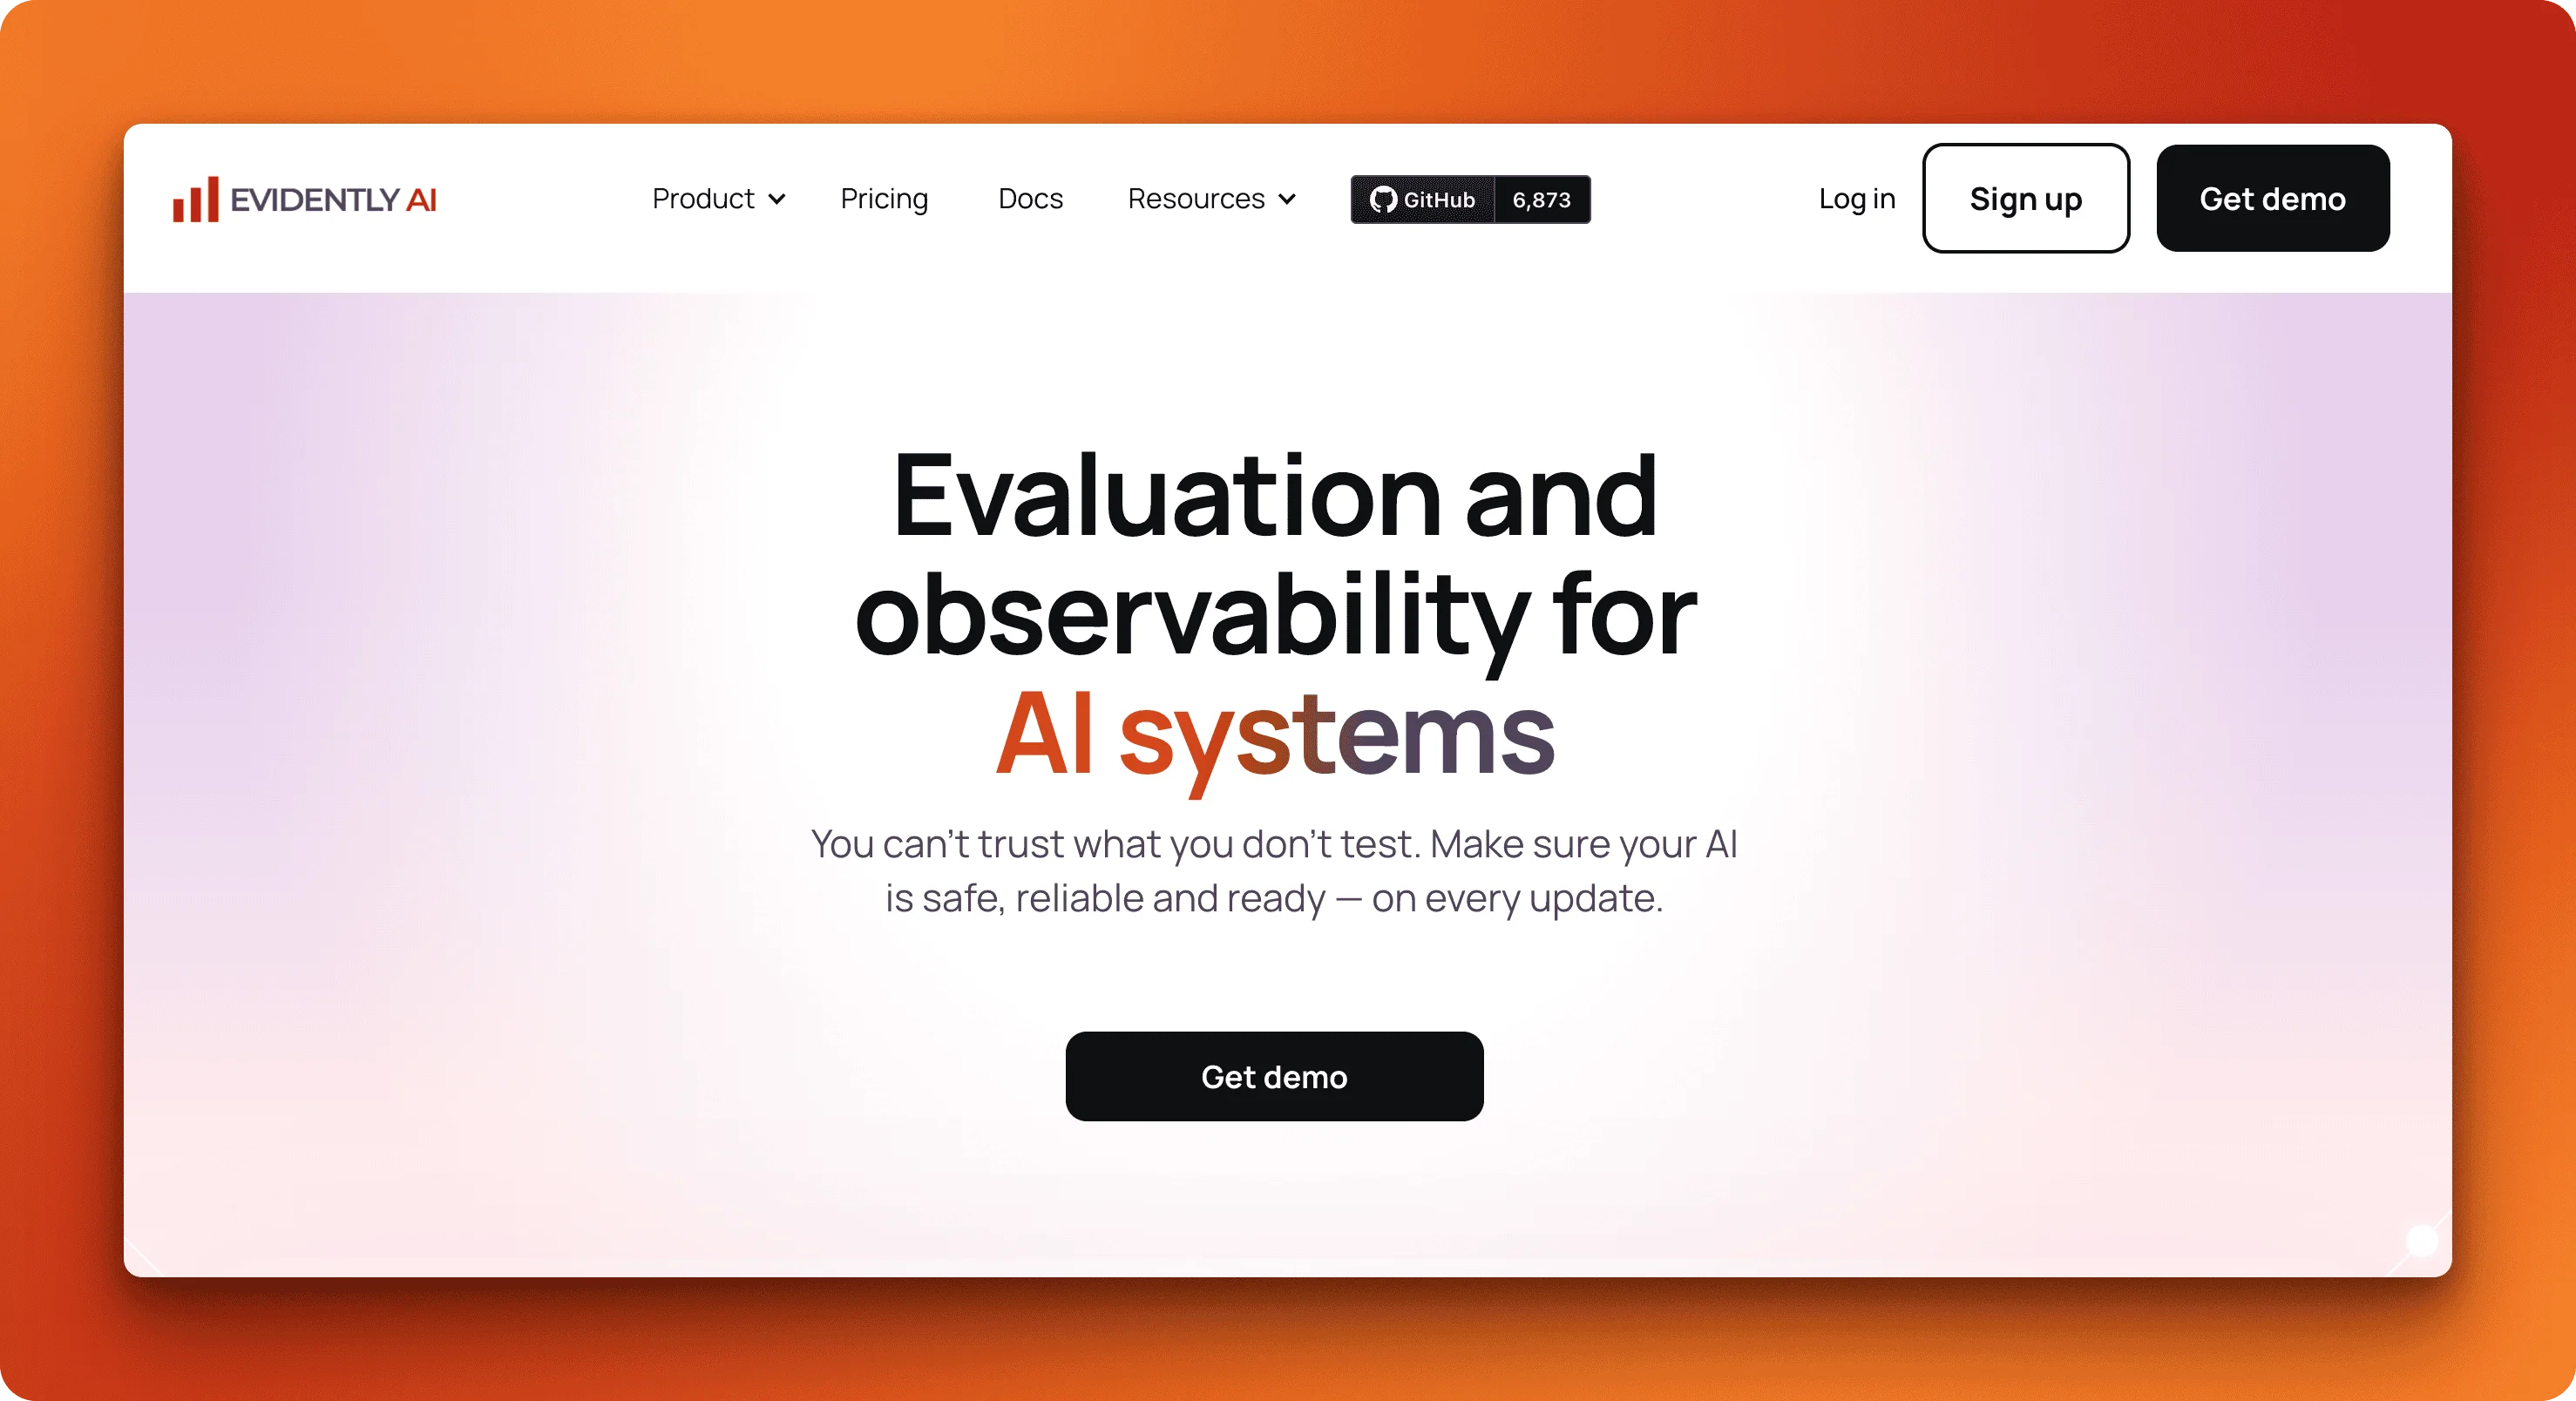
If your team runs both traditional ML models and LLM applications, Evidently offers unified evaluation across both. The library downloaded over 25 million times provides 100+ built-in metrics covering data drift and feature quality for ML models, plus output quality and hallucination detection for LLMs.
The declarative testing API lets you define evaluation suites as code, running them in CI/CD or on production traffic. A visual interface helps explore results without writing queries. Evidently Cloud adds tracing, synthetic data generation, and alerting for teams wanting a managed experience.
Best for teams running both traditional ML and LLM workloads who want one evaluation framework. The LLM-specific features are solid but not as deep as dedicated tools like TruLens or Galileo.
Our top pick
Arize Phoenix. The OpenTelemetry foundation prevents vendor lock-in while the combination of tracing, evaluation, and prompt management covers most quality assurance needs. Open source with active development and a growing community.
Gateway and proxy
Best for: Cost optimization, routing, quick setup
Gateway tools sit between your application and LLM providers, adding observability without changing your code. They're the fastest path to production monitoring, often requiring just a URL change or single header. The trade-off is depth: you get excellent cost tracking and request logging, but less sophisticated evaluation than dedicated platforms.
Helicone
Helicone wins on simplicity. Change your base URL or add a single header, and you're logging every LLM request in under two minutes. The open source platform (5,800+ GitHub stars) supports 100+ models across OpenAI, Anthropic, Google, Groq, and others through an OpenAI-compatible API.
The feature set focuses on practical production needs: unified billing across providers with zero markup, automatic fallbacks when a provider goes down, and response caching to cut costs on repeated queries. The dashboard surfaces costs, latency, and usage patterns without configuration.
A generous free tier handles most development and early production needs. The limitation is evaluation depth. Helicone tracks what happened but doesn't assess whether responses were good. For quality measurement, you'll pair it with another tool.
Portkey
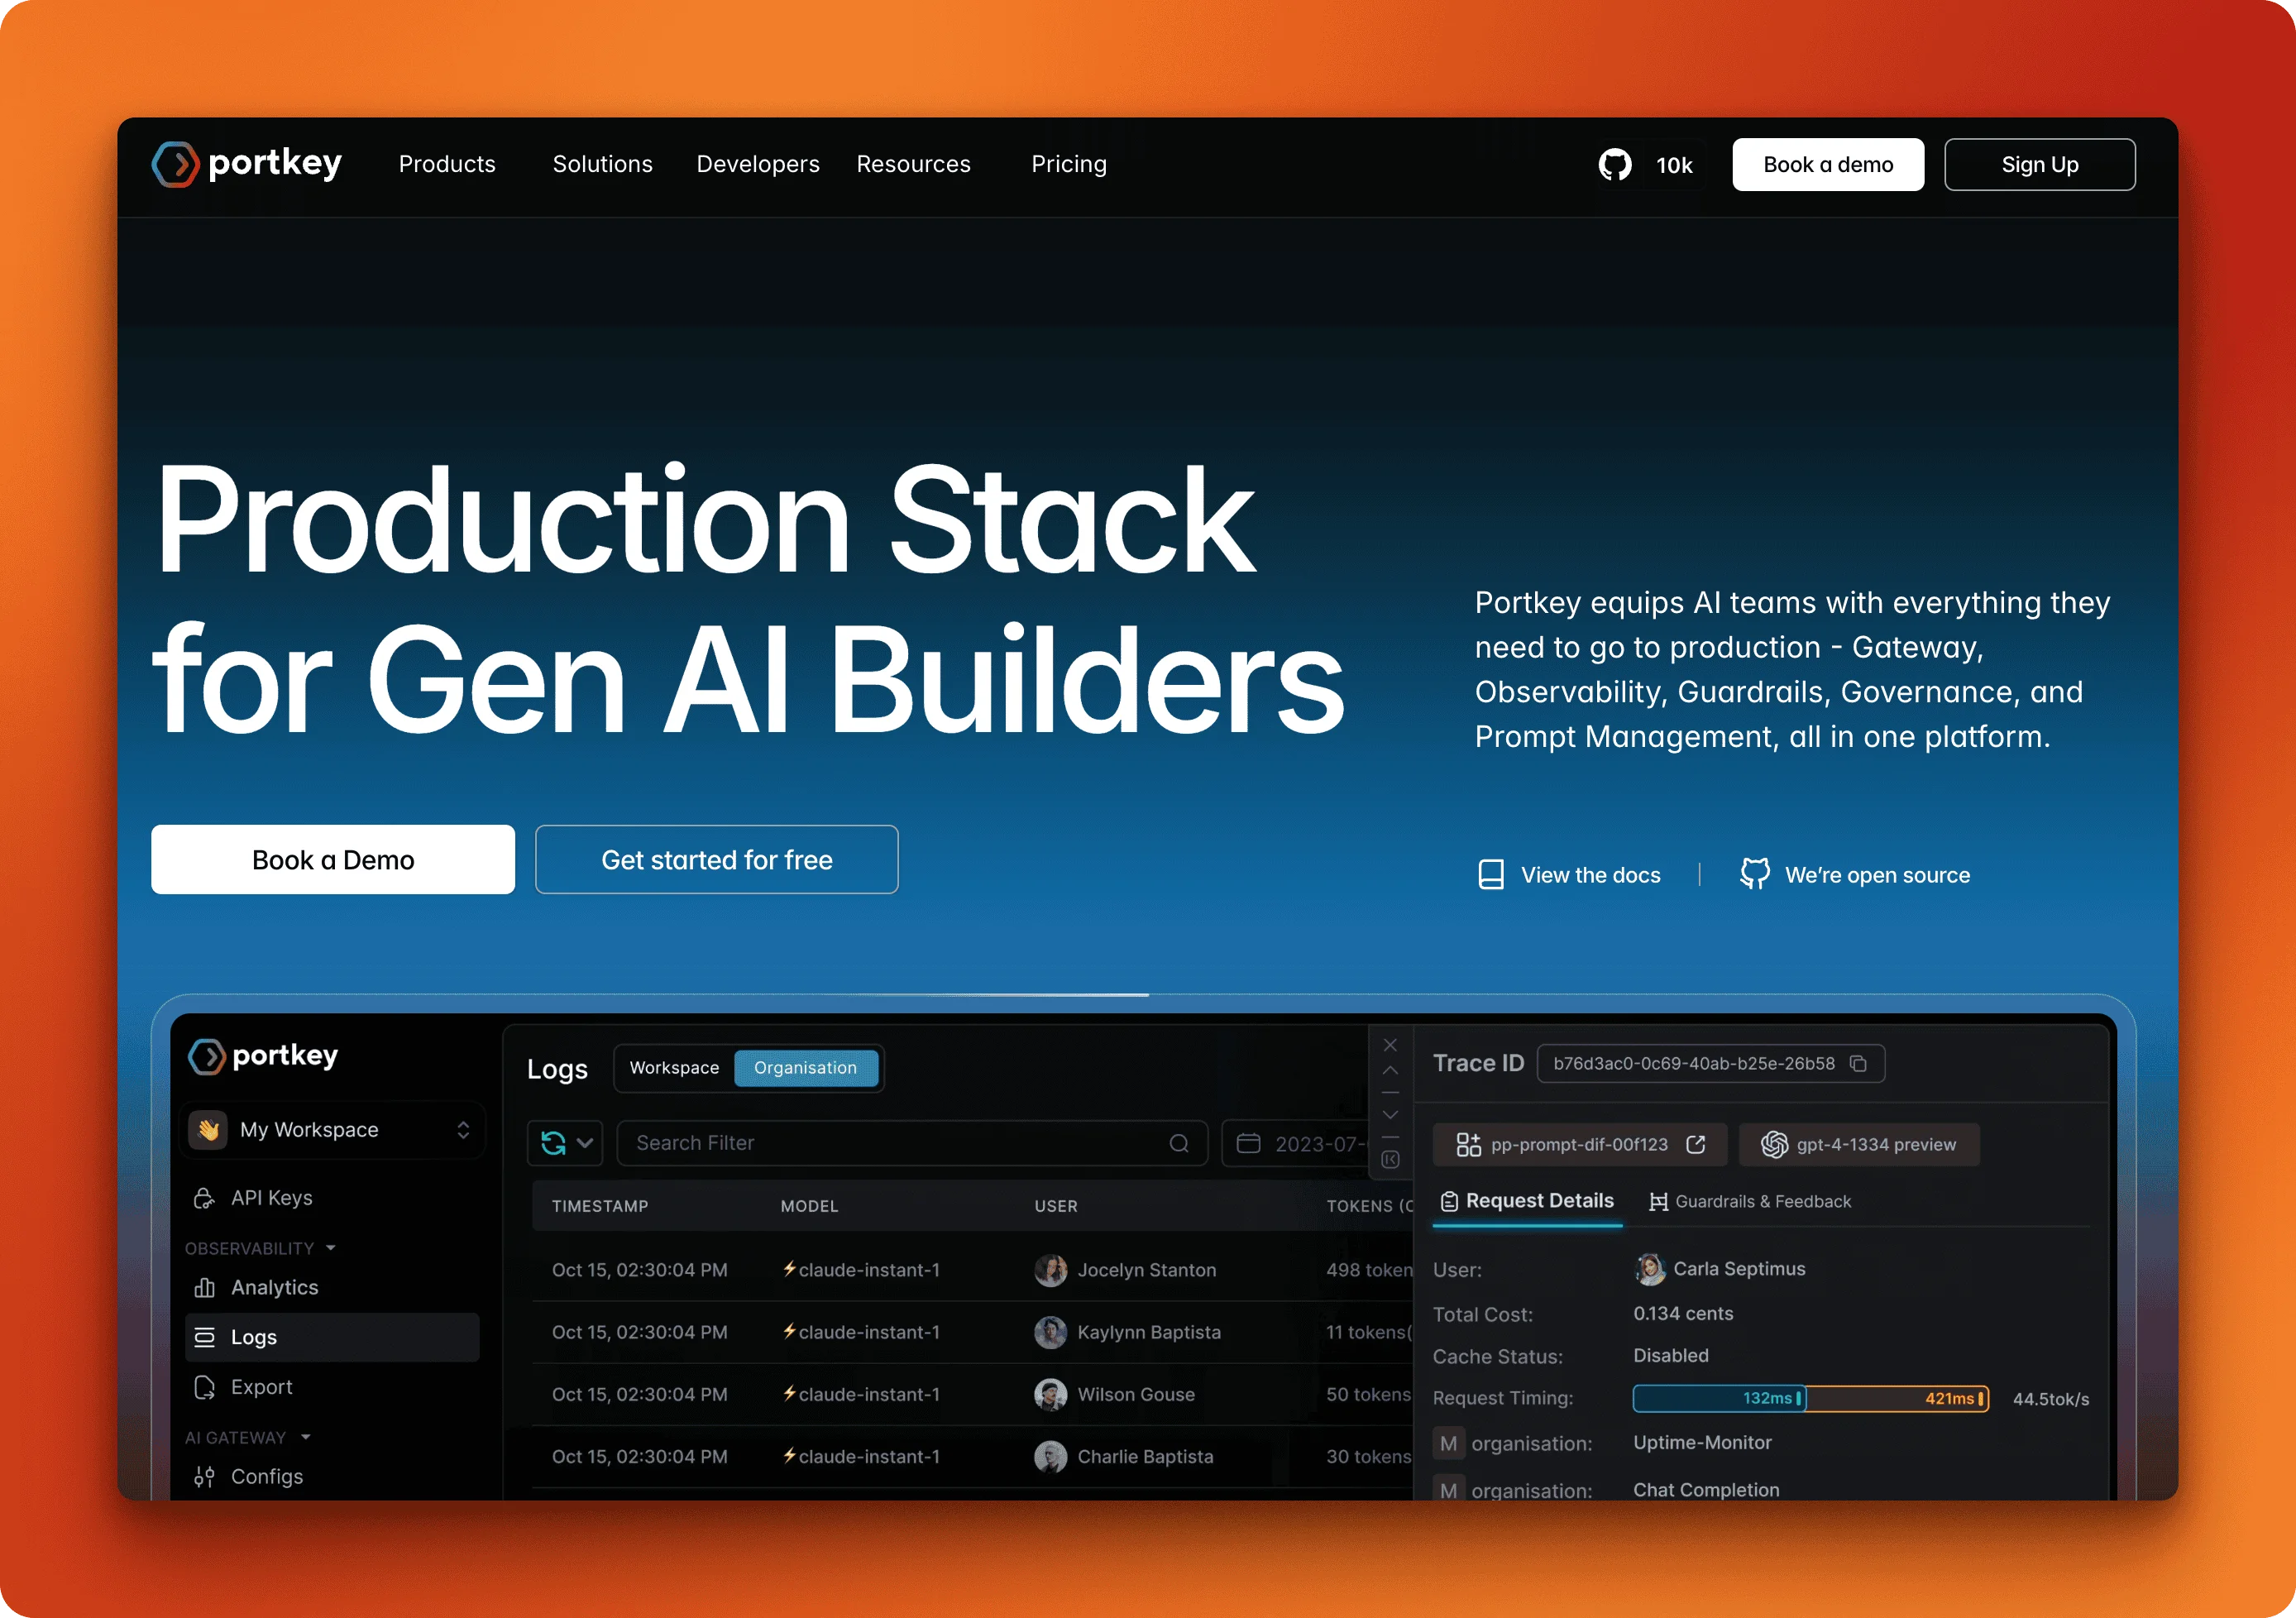
Portkey takes the gateway concept further with support for over 250 AI models and enterprise-grade infrastructure. The open source gateway (12,000+ GitHub stars) runs on global edge workers with just 20-40ms latency overhead, handling millions of requests per minute at 99.99% uptime.
Beyond basic proxying, Portkey adds reliability features:
- Automatic fallbacks between providers
- Load balancing across model endpoints
- Request caching and rate limiting
- Semantic caching for similar queries
The platform is ISO 27001 and SOC 2 certified with GDPR and HIPAA compliance, making it viable for regulated industries. Enterprise customers can deploy in private cloud environments. The free tier covers 10,000 requests per month, with paid plans adding advanced routing and analytics.
The trade-off is complexity. Portkey does more than simple proxying, which means more configuration to get the most from it.
Traceloop (OpenLLMetry)

Traceloop built OpenLLMetry (7,200+ GitHub stars) as an open source observability layer based entirely on OpenTelemetry standards. If you already run Datadog, Honeycomb, Grafana, New Relic, or another APM tool, OpenLLMetry pipes LLM traces directly into your existing stack.
The SDK approach requires adding initialization code rather than just changing URLs, but provides richer instrumentation. Decorators let you annotate workflows and tasks, creating detailed traces that show exactly how your application processes requests. SDKs cover Python, TypeScript, Go, and Ruby.
Traceloop offers a managed platform for teams without existing observability infrastructure. The open source library is completely free, with the managed service adding dashboards and alerting. Best for teams who want LLM observability integrated with their existing monitoring rather than another separate tool.
Our top pick
Portkey. The combination of 250+ model support, enterprise-grade reliability features, and active open source development makes it the most complete gateway option. Start with the free tier and scale up as needed.
Enterprise APM
Best for: Teams already on Datadog/New Relic
If your organization already runs Datadog, New Relic, or Weights & Biases, adding LLM observability to your existing stack often makes more sense than introducing another tool. These platforms extend their core monitoring capabilities to cover AI workloads, keeping everything in one place.
Datadog LLM Observability

Datadog brings LLM monitoring into its unified observability platform. If you already use Datadog for APM, infrastructure, or logs, LLM Observability adds AI-specific tracing without fragmenting your monitoring setup.
The SDK auto-instruments OpenAI, LangChain, AWS Bedrock, and Anthropic calls, capturing latency, token usage, and errors without code changes. Built-in evaluations detect hallucinations and failed responses, while security scanners flag prompt injection attempts and prevent data leaks. The 2025 release added LLM Experiments for testing prompt changes against production data before deployment.
Traces appear alongside your existing APM data, letting you correlate LLM latency with database queries or infrastructure issues. Pricing follows Datadog's consumption model, which can get expensive at scale. The LLM features require an existing subscription and add incremental costs based on usage.
New Relic AI Monitoring
New Relic extends its application performance platform to cover LLM workloads with AI Monitoring, keeping AI observability inside the same stack you already use for backend services. The 2025 Agentic AI Monitoring release focuses specifically on multi-agent systems, providing visibility across interconnected agents and the services they depend on.
Key differentiators:
- Agents Service Map showing all interactions between AI agents
- AI Trace View for step-by-step debugging with latency and error details
- 50+ integrations covering LLMs, ML libraries, and vector databases
- MCP Server integration for accessing observability data from GitHub Copilot, Claude, or Cursor
New Relic reports 30% quarter-over-quarter growth in AI Monitoring adoption, with Python and Node.js dominating customer deployments. Pricing follows the same consumption-based model as Datadog and requires an existing subscription. The platform excels at connecting AI issues to broader application performance problems.
W&B Weave

For teams focused more on experimentation than production monitoring, Weights & Biases built Weave to extend their ML experiment tracking capabilities to LLM applications. Rather than competing with traditional APM tools, Weave brings the experiment-tracking approach you already know to AI workloads. The open source library (1,000+ GitHub stars) adds tracing with a simple decorator: @weave.op() on any Python function.
Weave automatically logs calls to OpenAI, Anthropic, and other LLM libraries, recording inputs, outputs, metadata, token usage, and costs. Traces appear in the familiar W&B dashboard alongside your ML experiments, creating a unified view of model development and production behavior.
This works best for teams running both traditional ML models and LLM applications who want one platform for experiment tracking across both. Weave is free to start with included credits. The focus on MLOps workflows means teams needing alerting and incident response should look elsewhere.
Our top pick
Use what you have. If you're already paying for Datadog, add LLM Observability. If you're on New Relic, use AI Monitoring. If you run W&B for experiments, try Weave. The value here is consolidation, not features. Introducing a new vendor defeats the purpose of this category.
How to choose your tool
With 16 tools across four categories, the right choice depends on what you're building, how big your team is, and what tech stack you're using. Start by matching your application type to the tools designed for it.
By use case
RAG applications need strong evaluation features. TruLens focuses on RAG metrics (context relevance, groundedness, answer relevance), while Phoenix offers OpenTelemetry integration for unified observability. End-to-end visibility in RAG systems means monitoring from data extraction (where tools like Firecrawl structure web content) through retrieval and generation.
If you're building AI agents instead, you'll need detailed tracing for multi-step workflows. Langfuse and LangSmith work well for debugging agent chains, showing you exactly where decisions happen. For teams already on Datadog or New Relic, their 2025 agentic monitoring features provide service maps across interconnected agents.
Chatbots shift the focus to conversation quality and cost control. Helicone offers the fastest setup with automatic cost tracking. Galileo's Luna-2 models provide real-time guardrails if you need to block problematic responses before they reach users.
By team size
Your team's size affects both what you need and what you can realistically maintain. Solo developers or pairs should start simple: Helicone gets you logging in minutes, while Langfuse offers more features with a generous free tier if you want full observability from day one.
Small teams (3-10 people) benefit from all-in-one platforms that reduce maintenance overhead. Langfuse for its adaptability, LangSmith if you're already using LangChain.
As you scale to mid-size teams (10-50), you can justify combining focused tools. Phoenix for evaluation plus Portkey for routing gives you depth without platform lock-in.
Enterprise teams (50+) should extend existing infrastructure rather than adding another vendor. If you run Datadog or New Relic, add their LLM modules. If you already use MLflow for ML experiment tracking, its LLM features are a natural extension. Otherwise, deploy Langfuse self-hosted for data control.
By tech stack
The framework you're using often determines which tool integrates most smoothly. LangChain users get the most from LangSmith, where the integration is automatic and the debugging tools understand LangChain's internals.
LlamaIndex users should look at Phoenix or Langfuse, both integrate well and provide good visibility into retrieval steps. For vanilla API calls, gateway tools like Helicone and Portkey work best since they require just a URL change or header to start logging.
Multi-framework setups benefit from OpenTelemetry-based tools like Phoenix, TruLens, or OpenLLMetry that work across any stack. Teams running both ML and LLM workloads should consider MLflow, Evidently AI, or W&B Weave for unified monitoring across both.
Still unsure? Start with Langfuse if you want a full-featured platform, or Helicone if you need observability in production today. Both have generous free tiers and you can migrate later if your needs change.
Conclusion
Don't overthink your first choice. Pick one tool from the category that matches your biggest pain point and start collecting data. You can always switch later.
Instrument early, because adding observability after you're in production means you'll have no history when something breaks. Even a simple gateway like Helicone takes minutes to set up and gives you cost tracking from day one.
Start with the basics: cost, latency, and error rates. Add quality metrics like hallucination detection once you have baseline visibility and know what actually matters for your application. Your observability stack will grow with your needs.
One thing observability can't fix is bad input data. For RAG applications especially, structured web data from tools like Firecrawl prevents issues that would otherwise show up as mysterious quality drops in your dashboards.
Pick a tool, add instrumentation, and ship it.
Frequently Asked Questions
Which LLM observability tools are actually open source?
Langfuse (MIT license), Opik (Apache 2.0), and MLflow (Apache 2.0) are fully open source with no restrictions. Phoenix, TruLens, Evidently, Helicone, Portkey, OpenLLMetry, and Weave have open source versions but may offer additional features in their cloud products. LangSmith, Braintrust, Galileo, Datadog, and New Relic are commercial platforms with free tiers.
Can I use multiple LLM observability tools together?
Yes, and many teams do. A common setup is a gateway tool (Helicone or Portkey) for cost tracking and routing, paired with an evaluation tool (Phoenix or TruLens) for quality metrics. OpenTelemetry-based tools like Phoenix and OpenLLMetry make this easier since they export traces in a standard format that multiple platforms can consume. For teams already using MLflow for ML experiment tracking, its LLM tracing and AI Gateway can extend that existing workflow rather than adding another tool.
Should I self-host my LLM observability tool or use a cloud version?
Cloud is faster to start and requires no maintenance. Self-host if you have strict data residency requirements, need to keep prompts and responses on your own infrastructure, or want to avoid per-request pricing at scale. Langfuse, Phoenix, Helicone, and Portkey all have well-documented self-hosting options.
How much do LLM observability tools cost?
Most tools offer generous free tiers that cover development and early production. Langfuse, Phoenix, and Helicone let you self-host for free. Cloud pricing varies: LangSmith starts at $39/user/month, Datadog charges $8 per 10k requests, and New Relic uses consumption-based pricing tied to data ingestion. Gateway tools like Helicone and Portkey typically charge zero markup on LLM costs.
Do I need LLM observability if I'm just prototyping?
Not strictly, but adding it early is easier than retrofitting later. A simple gateway like Helicone takes two minutes to set up and gives you cost tracking from day one. When something breaks in production, you'll have the history to debug it.
Which LLM observability tool works best with my framework?
LangSmith integrates most deeply with LangChain and LangGraph. Phoenix and Langfuse work well with LlamaIndex. For vanilla OpenAI or Anthropic API calls, gateway tools like Helicone and Portkey require just a URL change or header to start logging. If you use multiple frameworks, OpenTelemetry-based tools (Phoenix, TruLens, OpenLLMetry, MLflow) provide consistent instrumentation across all of them.
What LLM metrics should I track first?
Start with cost and latency since they're easy to measure and immediately actionable. Add error rates next. Once you have baseline visibility, layer in quality metrics like hallucination detection and relevance scoring. Don't try to track everything at once.